7 But lack of competition?
(where you learn why markets fail when someone has too much power)
So far we have painted markets as a “heaven on earth,” a place where resources are allocated optimally and everyone benefits. But reality is more nuanced, and there are many situations where markets perform poorly. In the next three chapters we will dive into these fascinating phenomena called market failures. We will analyse why they arise, what effects they have and what can be done to make markets work better.
In this chapter we will look at what happens when buyers and sellers do not interact on equal terms. Consider, for example, the following:
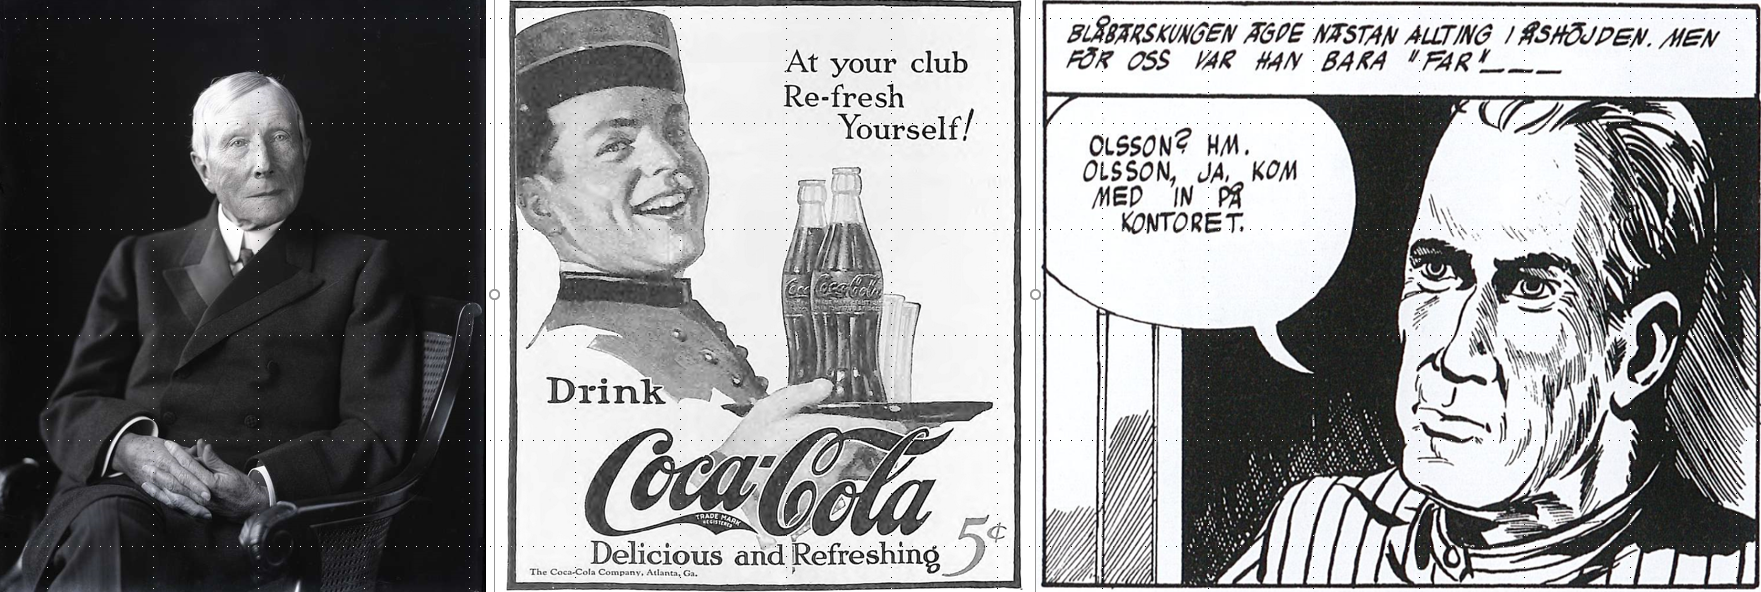
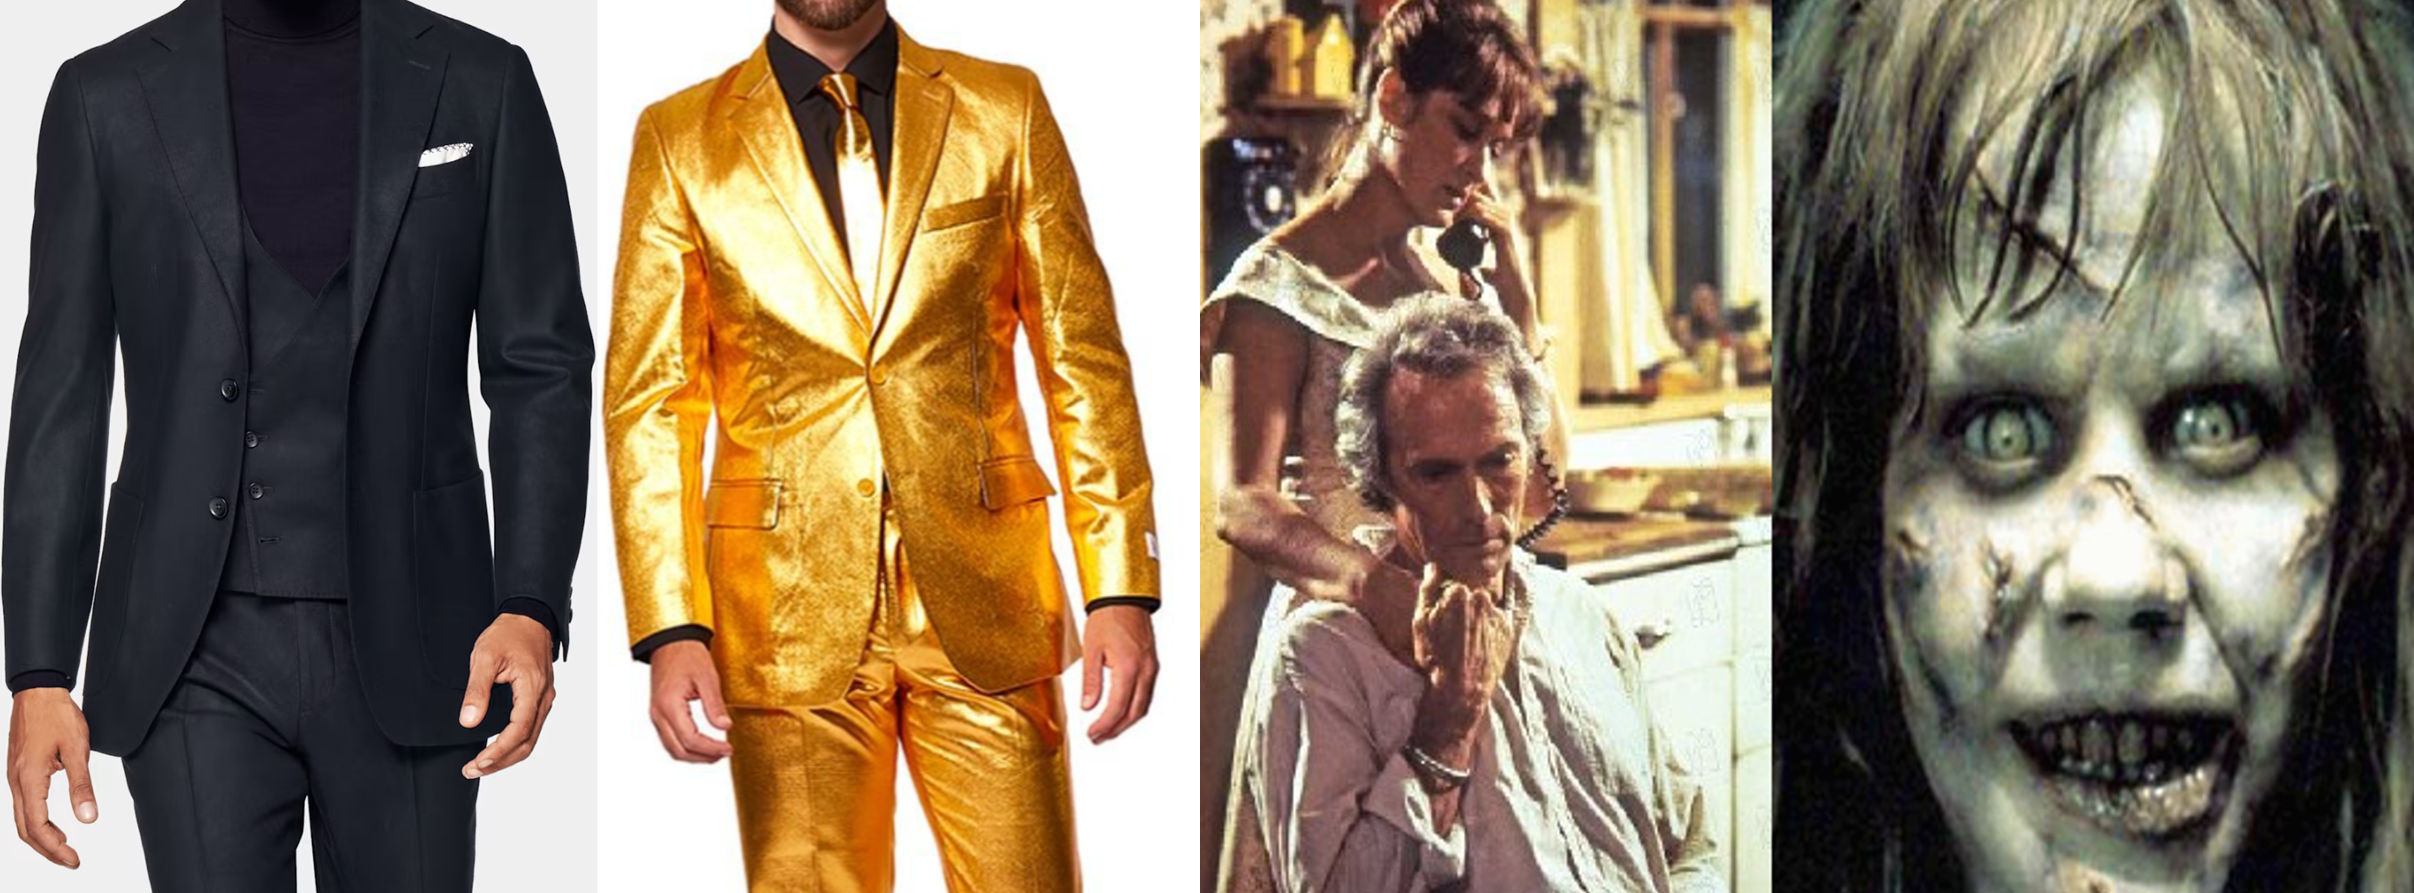
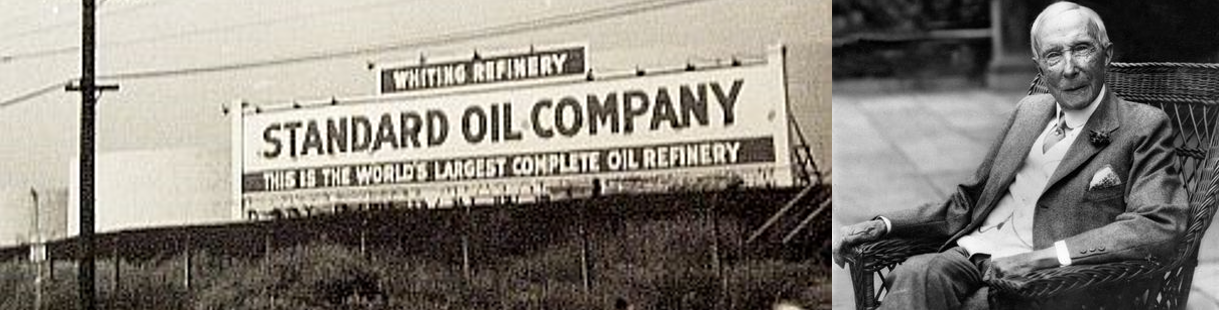
All three pictures show people and firms that have gained large market influence. As always when someone becomes powerful, there is an obvious risk that the powerful party will exploit its position to benefit itself at the expense of others — and perhaps society as a whole. By the end of the chapter you will understand several fascinating phenomena:
- How could John D. Rockefeller make $318 billion?
- Why does advertising lead to higher prices?
- Why do young people in rural areas often have such low wages?
- What’s the deal with discount codes?
- How is it possible that there are 48 varieties of toothpaste at CityMarket?
7.1 Monopoly: No competition among sellers
Let’s begin by analysing the effects of a monopoly. A monopoly means there is only one seller in the market — and it is impossible for new firms to enter the market. Before we tackle the more technical solutions it is important that you first grasp the basic idea. We therefore start with a few intuitive examples:
“Jonte’s Strawberries” takes over the whole market
Jenny is on her way to the Market Square to buy strawberries. One of the many vendors there is Jonte’s Strawberries. Competition among sellers is fierce, which forces them to set the lowest possible price: Jonte simply cannot sell at €5 if Pia is selling at €4.50 — everyone will go to her instead. The fight for customers pushes Pia and Jonte to prices that nearly drive them out of business.
Moreover, Pia and Jonte constantly live under the threat that new sellers will enter the market and push prices down:
“When Raw Food became trendy it was brilliant for a few days,” Jonte says. “Suddenly everyone wanted strawberries. That week I sold loads and at high prices. But then people started saying… that Pia and I were rolling in money. The following week new sellers popped up at the market, mostly ÅA students who’d dropped out to sell strawberries instead. They smell money — it’s like flies to a sugar cube. Then it’s knife‑to‑the‑throat again.” (see Section 6.3).
Then, suddenly, a miracle happens. The mayor — an old classmate of Jonte’s — decides to grant Jonte the exclusive right to sell strawberries at the market. How do you think the shift from perfect competition to a monopoly will affect sales? Think this way: the demand curve shows how much customers want to buy at different prices, but because Jonte now is the sole seller the curve shows how much customers want to buy from Jonte — because Jonte is the whole market. With competitors barred from the market Jonte can choose any point along the demand curve. He can sell expensively and little (for example 10 litres at €7) or cheaply and a lot (for example 70 litres at €1). But what is the smartest choice if Jonte wants to maximise profit? The answer is that Jonte will pick a price somewhere along the thick blue curve below. Do you see why?
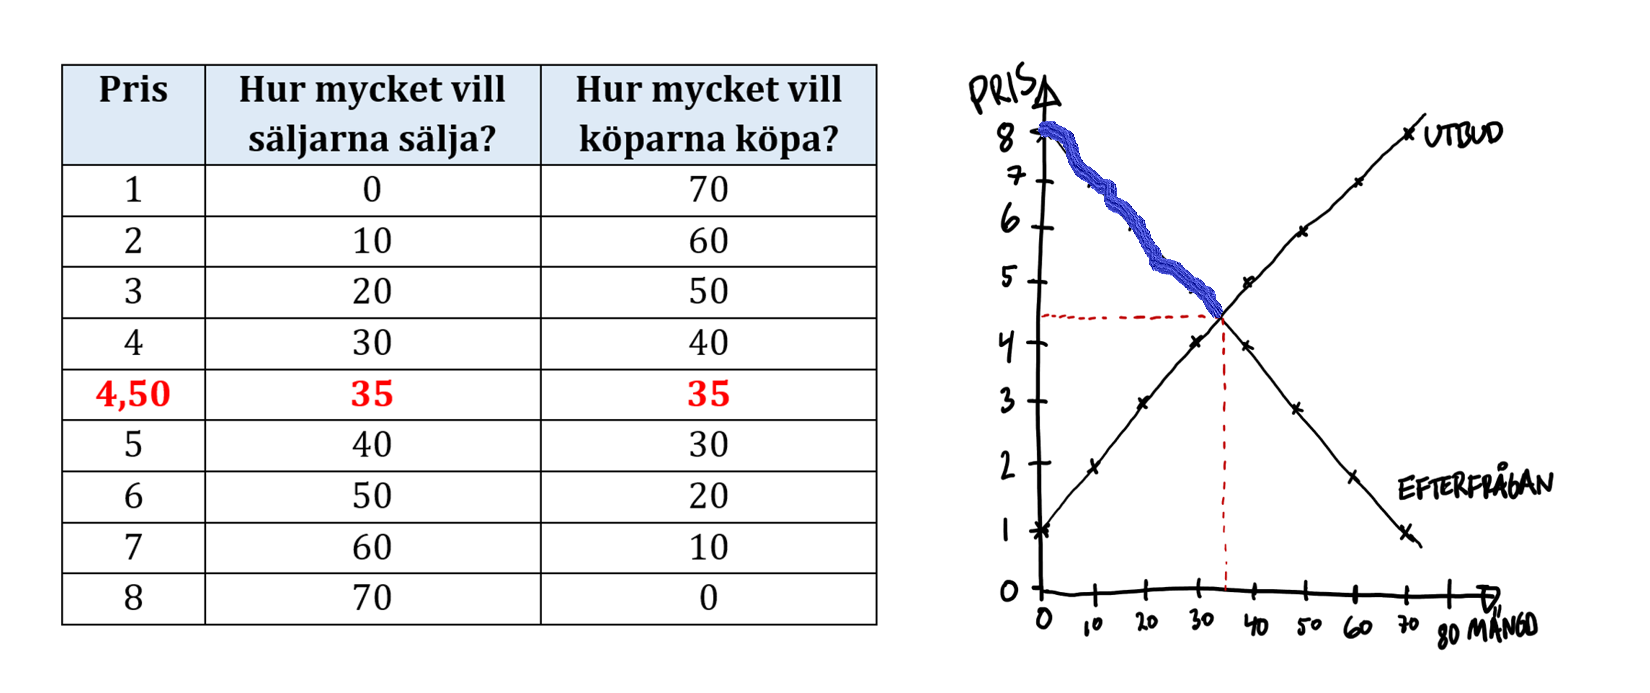
Yes — Jonte will not set the price at €4.50 or lower — that was the level at which fierce competition almost drove him under. Nor will he set the price at €8 or above — at that level nobody would buy. Somewhere in the interval €4.51–€7.99 the monopolist will choose his price.
The lesson is that monopoly leads to higher prices compared with perfect competition. Because the price is higher, people buy less. And since the quantity traded under perfect competition was socially optimal, the quantity under monopoly must be inefficiently low. Monopolies also often entail poorer quality: some of the strawberries are soft from sitting too long in the sun and Jonte frequently treats customers badly. Jonte doesn’t care much — he knows he is the only seller in the market and that Jenny and the other buyers have nowhere else to go.
High prices, inefficiently small output, huge profits for the firm and often low quality — all because there is no rival to challenge Jonte. Do you now see why firms strive to obtain monopoly power while economists typically oppose monopolies and fight to remove barriers that protect incumbent firms from competition?
monopoly is when a single seller can set the price of a good because they have total control over the supply
The scandal of the Finnish asphalt cartel 1994–2002
The news about the asphalt cartel hit like a bomb: during 1994–2002 seven Finnish asphalt companies allegedly stole up to half a billion euros from taxpayers. It was an effective scheme. Instead of the seven firms competing for contracts, they agreed in advance which firm would win each tender, and the other firms deliberately submitted higher bids than the pre‑selected winner. It was as if the seven companies had joined up to form a single firm—a monopoly. In this way the firms received roughly 15% more pay than they would have under real competition.

Cartels are one of the gravest threats to competition and amount to economic crime. They cause substantial economic harm to customers, markets and society at large. In recent years cartels have been exposed in Finland — for example in bus transport, building insulation and among driving schools. Despite several uncovered cases it is likely many cartels remain undetected. To find them the Competition Authority has begun using new statistical methods to identify markets where firms’ behaviour suggests cartel activity. With these methods they hope to uncover more cartels.
cartel is a (secret) agreement among firms to avoid competition, allowing them to act together like a monopolist.
Oil crises and drug cartels
Jonte was better off once he no longer faced competition from the other strawberry sellers at the market — suddenly he could raise prices and increase his profits. The same basic mechanism explains the oil crises of the 1970s and the wars over narcotics.
In October 1973 the oil‑producing countries in OPEC (including Saudi Arabia, Iraq and Kuwait) agreed to act like a monopolist. Instead of fiercely competing with one another, the cartel countries cut production, which in theory would push up the oil price and raise their revenues. The figure below shows what actually happened: the oil price indeed jumped from USD 20.69 per barrel to USD 72.84. The oil‑producing countries celebrated huge profits while large parts of the Western economy were plunged into a deep crisis. (As you can see, the price rose again in 1979 — that crisis was driven by the Iranian revolution, which sharply reduced oil supply and drove prices even higher.)
The same logic helps explain today’s gang wars. Eliminating rivals gives you monopoly‑like profits. Another option is to collude with competitors in a cartel — for example the drug cartels in South America.
But how do we know exactly how much worse things get under monopoly compared with perfect competition? How much higher do prices go, how much larger do profits become, and how large are the welfare losses for society? To answer all these questions we need to dig deeper into the analysis.
Monopoly: A deeper analysis
In the previous chapter you learned that a profit‑maximising firm always produces where MR = MC: the last unit should raise revenue by exactly as much as it costs to produce. If one more unit would bring in more revenue than it costs, it would be foolish not to increase production, right?
Imagine you have a small farm outside Turku producing about 800 kg of wheat per year. This is a market with fierce competition. There are thousands of competitors selling wheat; in 2024 about 798 million tonnes of wheat were produced worldwide. Compared with 798 million tonnes your 800 kg is just a drop in the ocean. If you suddenly increased production to 900 kg it would hardly be enough to depress the world price, and if you closed the farm the world price would not noticeably rise. You are therefore a price taker on the wheat market and must sell at the market price. Each extra kilogram you sell therefore always raises your revenue by the price, so MR = P.
This is not true under monopoly. The crucial insight is that the monopolist can set the price. Below I have sketched the market for genuine Champagne. By definition Champagne is a sparkling wine from the Champagne region of northern France. All the world’s Champagne is produced there, mainly in the small town of Reims. Suppose you are CEO of the world’s only firm producing Champagne. How should you act to make the firm’s profit as large as possible?
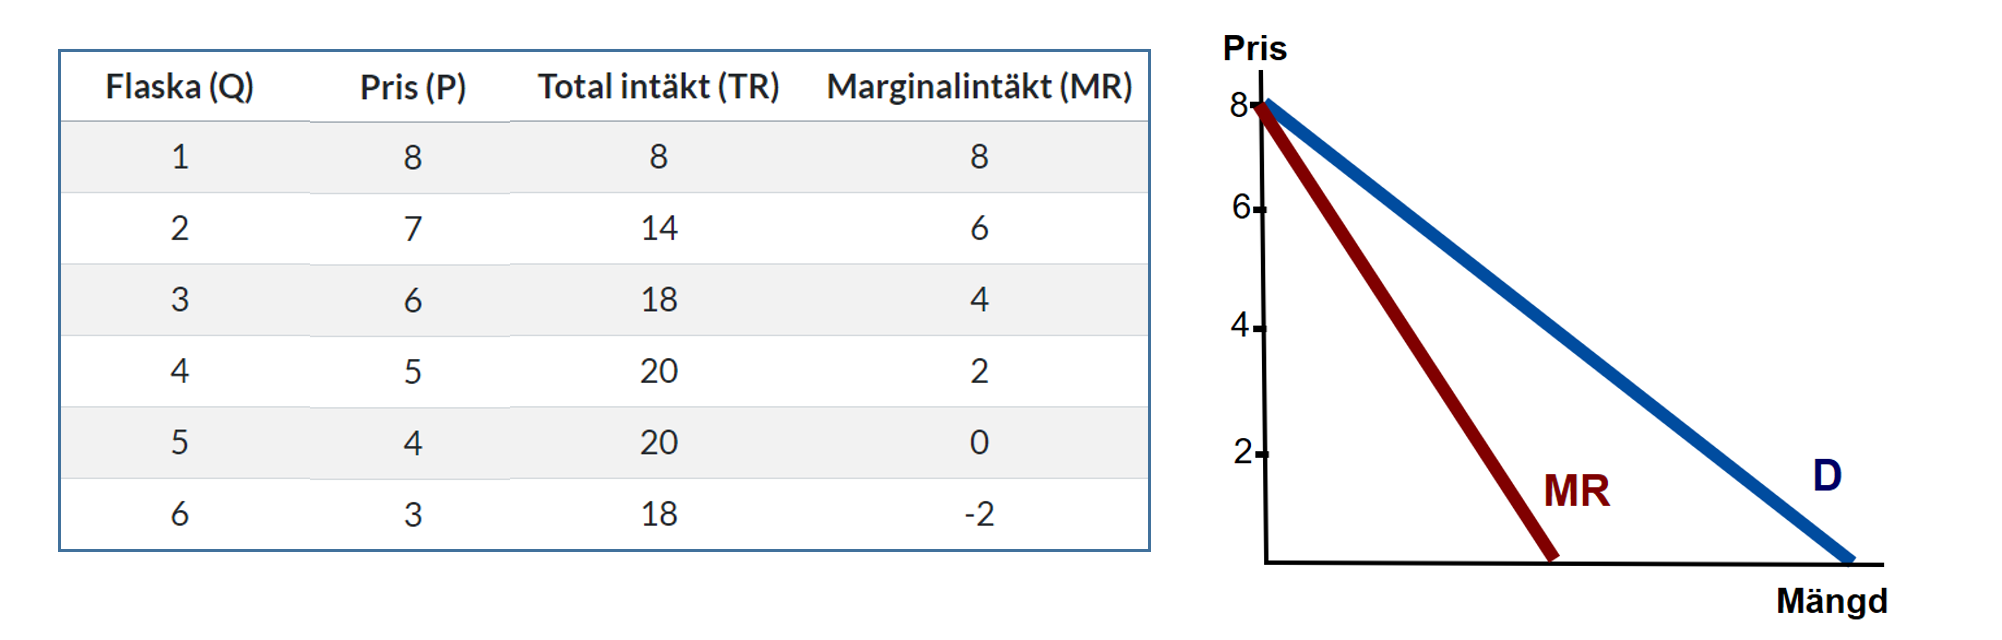
Think of it this way: the demand curve shows the world’s demand for Champagne, but because there is only one producer this is also the demand for your Champagne. Customers have nowhere else to go. You can therefore choose where on the curve to sell: expensive and little, or cheap and much. For example, if you set the price at €8 you sell only one bottle and receive €8. To sell two bottles you must lower the price to €7, yielding total revenue €14. Selling two bottles instead of one therefore increased revenue from €8 to €14. The marginal revenue (MR) from the second bottle was thus €6. Selling more has two effects: you sell more (good!), but to sell more you had to cut the price and sell every bottle at a lower price (bad!). Note that the MR curve starts at the same intercept as the demand curve but then falls faster. This happens because the monopolist — to sell one more bottle — must lower the price not only on that bottle but on all bottles.
Once you understand that the MR curve shares the demand curve’s intercept but has a steeper slope, the hardest part is done. Then just remember that every profit‑maximising firm always produces the quantity where marginal revenue equals marginal cost. So set MR = MC and solve for quantity. Now you know how much the monopolist will produce to maximise profit — but what price will the firm set? Read off the demand curve to see how much consumers are willing to pay for that last unit. A smart, rational monopolist seeking to maximise profit will most likely set the price there, right?
Predicting output and price in a monopoly market is not trivial, so think your analysis through carefully. Let’s repeat the exercise with the app below. I have entered the monopolist’s cost data and the market demand. Click Calculate and plot! and the computer will show what happens in the market.
Monopoly: Restrict the quantity.
Experiment with the curves to understand the monopolist’s choice and the cost to society.
#| standalone: true
#| viewerHeight: 1600

if (!requireNamespace("shiny", quietly = TRUE)) install.packages("shiny")
if (!requireNamespace("ggplot2", quietly = TRUE)) install.packages("ggplot2")
if (!requireNamespace("plotly", quietly = TRUE)) install.packages("plotly")
if (!requireNamespace("grid", quietly = TRUE)) install.packages("grid")

library(shiny)
library(ggplot2)
library(plotly)
library(grid)

safe_numeric <- function(value) {
  if (is.null(value) || value == "" || is.na(value)) return(0)
  as.numeric(value)
}

ui <- fluidPage(
  titlePanel(""),
  sidebarLayout(
    sidebarPanel(
      numericInput("a", "Fasta kostnader (€)", value = 15, min = 0),
      numericInput("b", "Rörliga linjära kostnader (€)", value = 1, min = 0),
      numericInput("c", "Rörliga kvadratiska kostnader (€)", value = 0.1, min = 0),
      textInput("demand_intercept", "Ange interceptet för efterfrågekurvan:", "15"),
      textInput("demand_slope", "Ange lutningen för efterfrågekurvan:", "-0.1"),
      numericInput("y_max", "Y-axelns maxvärde i figuren", value = 20, min = 1),
      numericInput("x_max", "X-axelns maxvärde i figuren", value = 100, min = 1),
      actionButton("calculate", "Beräkna och rita!"),
      width = 3
    ),
    mainPanel(
      verbatimTextOutput("expressions"),
      plotlyOutput("costPlot"),
      br(),
      verbatimTextOutput("optimalLevel"),
      width = 9
    )
  )
)

server <- function(input, output, session) {
  # Ensure numeric inputs are not empty
  observe({
    if (is.na(input$a) || input$a == "") updateNumericInput(session, "a", value = 0)
    if (is.na(input$b) || input$b == "") updateNumericInput(session, "b", value = 0)
    if (is.na(input$c) || input$c == "") updateNumericInput(session, "c", value = 0)
    if (is.na(input$x_max) || input$x_max == "") updateNumericInput(session, "x_max", value = 100)
    if (is.na(input$y_max) || input$y_max == "") updateNumericInput(session, "y_max", value = 20)
  })

  observeEvent(input$calculate, {
    a <- safe_numeric(input$a)
    b <- safe_numeric(input$b)
    c <- safe_numeric(input$c)
    demand_intercept <- safe_numeric(input$demand_intercept)
    demand_slope <- safe_numeric(input$demand_slope)
    y_max <- max(1, safe_numeric(input$y_max))
    x_max <- max(1, safe_numeric(input$x_max))

    demand_function <- function(q) demand_intercept + demand_slope * q
    MR_function <- function(q) demand_intercept + 2 * demand_slope * q

    # q-grid: up to reasonable multiple of x_max, with fine resolution near optimum later
    q_values <- seq(0.1, max(1000, x_max * 5), by = 1)
    atc_values <- a / q_values + b + c * q_values
    mc_values <- b + 2 * c * q_values
    demand_values <- demand_function(q_values)
    mr_values <- MR_function(q_values)

    plot_data <- data.frame(
      q = q_values,
      ATC = atc_values,
      MC = mc_values,
      Demand = demand_values,
      MR = mr_values
    )

    # Find optimum where MR ≈ MC, refine locally
    optimal_q <- NA
    diff <- abs(mc_values - mr_values)
    min_idx <- which.min(diff)
    tol_coarse <- max(0.5, 0.005 * abs(demand_intercept)) # adaptive tolerance
    if (diff[min_idx] < tol_coarse) {
      left <- max(1, q_values[max(1, min_idx - 5)])
      right <- q_values[min(length(q_values), min_idx + 5)]
      refined_q <- seq(left, right, by = 0.1)
      refined_mc <- b + 2 * c * refined_q
      refined_mr <- MR_function(refined_q)
      refined_diff <- abs(refined_mc - refined_mr)
      refined_idx <- which.min(refined_diff)
      if (refined_diff[refined_idx] < max(0.05, 0.001 * abs(demand_intercept))) {
        optimal_q <- refined_q[refined_idx]
      }
    }

    output$expressions <- renderPrint({
      cat("Totala kostnaderna (TC):\n")
      cat("TC = ", a, " + ", b, "q + ", c, "q²\n\n")
      cat("Genomsnittliga totala kostnaderna (ATC):\n")
      cat("ATC = ", a, "/q + ", b, " + ", c, "q\n\n")
      cat("Marginalkostnaderna (MC):\n")
      cat("MC = ", b, " + 2 * ", c, "q\n\n")
      cat("Efterfrågekurvan (D):\n")
      cat("P = ", demand_intercept, " + (", demand_slope, ") q\n\n")
      cat("Marginalintäktskurvan (MR):\n")
      cat("MR = ", demand_intercept, " + 2 * (", demand_slope, ") q\n")
    })

    output$costPlot <- renderPlotly({
      p <- ggplot(plot_data, aes(x = q)) +
        geom_line(aes(y = ATC, color = "ATC"), size = 1) +
        geom_line(aes(y = MC, color = "MC"), size = 1) +
        geom_line(aes(y = Demand, color = "Efterfrågan"), size = 1) +
        geom_line(aes(y = MR, color = "MR"), size = 1, linetype = "solid") +
        labs(x = "Produktionsnivå (q)", y = "Kostnader och intäkter (€)", color = NULL) +
        coord_cartesian(xlim = c(0, x_max), ylim = c(0, y_max)) +
        scale_color_manual(
          values = c("ATC" = "darkgreen", "MC" = "darkred", "Efterfrågan" = "blue", "MR" = "#d95f02"),
          labels = c("ATC" = "ATC", "MC" = "MC", "Efterfrågan" = "Efterfrågan", "MR" = "MR"),
          guide = guide_legend(override.aes = list(size = 0.9, linetype = c("solid", "solid", "solid", "solid")))
        ) +
        theme_minimal(base_size = 14) +
        theme(
          axis.title = element_text(size = 14, face = "bold"),
          axis.text = element_text(size = 12),
          legend.position = c(0.90, 0.85),
          legend.background = element_rect(fill = "white", color = "grey80", size = 0.5),
          legend.key = element_rect(fill = "transparent", color = NA),
          legend.text = element_text(size = 11),
          plot.margin = margin(10, 10, 10, 10)
        ) +
        geom_hline(yintercept = 0, color = "black", size = 0.6) +
        geom_vline(xintercept = 0, color = "black", size = 0.6)

      if (!is.na(optimal_q) && optimal_q > 0 && optimal_q <= x_max) {
        optimal_price <- demand_function(optimal_q)
        optimal_atc <- a / optimal_q + b + c * optimal_q

        p <- p +
          geom_segment(aes(x = optimal_q, xend = optimal_q, y = 0, yend = optimal_price),
                       linetype = "dashed", color = "purple") +
          geom_segment(aes(x = 0, xend = optimal_q, y = optimal_price, yend = optimal_price),
                       linetype = "dashed", color = "purple") +
          geom_segment(aes(x = optimal_q, xend = 0, y = optimal_atc, yend = optimal_atc),
                       linetype = "dashed", color = "#1b9e77") +
          geom_point(aes(x = optimal_q, y = optimal_price), color = "purple", size = 3)

        profit_polygon <- data.frame(
          x = c(0, optimal_q, optimal_q, 0),
          y = c(optimal_atc, optimal_atc, optimal_price, optimal_price)
        )
        p <- p + geom_polygon(data = profit_polygon, aes(x = x, y = y), fill = "grey40", alpha = 0.2)
      }

      ggplotly(p) %>%
        layout(
          font = list(size = 13, family = "Arial"),
          legend = list(
            bgcolor = "rgba(255,255,255,0.95)",
            x = 0.92, y = 0.85, xanchor = "right",
            font = list(size = 11)
          ),
          margin = list(l = 60, r = 60, t = 10, b = 60)
        )
    })

    output$optimalLevel <- renderPrint({
      if (!is.na(optimal_q)) {
        TC <- a + b * optimal_q + c * optimal_q^2
        ATC <- a / optimal_q + b + c * optimal_q
        MC <- b + 2 * c * optimal_q
        TR <- demand_function(optimal_q) * optimal_q
        Profit <- TR - TC

        cat("Den optimala produktionsnivån är q =", round(optimal_q, 3), "där MR ≈ MC.\n\n")
        cat("Vid denna nivå är:\n")
        cat("Marginalkostnad (MC) =", round(MC, 3), "\n")
        cat("Marginalintäkt (MR) =", round(MR_function(optimal_q), 3), "\n")
        cat("Pris (P) =", round(demand_function(optimal_q), 3), "\n")
        cat("Genomsnittlig total kostnad (ATC) =", round(ATC, 3), "\n")
        cat("Totala intäkter (TR) =", round(TR, 3), "\n")
        cat("Totala kostnaderna (TC) =", round(TC, 3), "\n")
        cat("Vinsten =", round(Profit, 3), "\n")
      } else {
        cat("Ingen optimal produktionsnivå hittades där MR ≈ MC inom intervallet som givits.\n")
      }
    })
  })
}

shinyApp(ui = ui, server = server)
Look at the figure and think about what it actually shows. Once the computer knows the demand curve it can automatically derive the MR curve. Remember MR starts at the same intercept as the demand curve but is steeper. Do you recall why? Imagine you, as the Champagne CEO, increase sales from 1,000,000 bottles to \(\small\text{1 000 001}\) bottles. That extra bottle does bring revenue, but to sell it you must lower the price slightly — and that lower price applies not only to the extra bottle but to the first million bottles as well. The effect is that your total revenue hardly rises when you expand output.
So how much should the firm in the app produce? The firm produces the quantity where the last unit brings in as much revenue (MR) as it costs to make (MC). With the costs and demand in the app’s baseline this occurs at quantity 35. And what are consumers willing to pay? Go all the way up to the demand curve and read off the price you can charge for selling 35 units. The answer is €11.50. You now know the firm sells 35 units at €11.50 each, which implies total revenue of €402.50.
To get profit you must also compute costs (profit = revenue − costs). What does it cost the firm to produce 35 units? There are two ways to find total cost. One is to plug \(\small\text{q=35}\) into \(\small TC=15+q+0,1q^2\), which gives \(\small TC=15+35+0,1×35^2=172.50\). Alternatively use the dark green ATC curve, which shows the average cost at each quantity. If the firm produces 35 units ATC indicates an average cost of just under €5 per unit (about €4.929), so total cost is 35 × 4.929 = €172.50. Profit is the dark shaded area in the figure.
Understanding monopoly and its effects is not trivial. Don’t be alarmed if you don’t grasp everything immediately. Practice — for example by solving the exercises at the end of the chapter. If you need more help, here are two old video clips where I explain monopoly:
Should monopolies always be fought?
For an individual firm a monopoly is desirable. Entry barriers that keep competitors out allow the firm to charge high prices and earn large profits — there is no longer any entry that would increase supply and push down prices and profits. Economists are generally sceptical of monopolies, however. The absence of competition tends to lead to higher prices and less trade. But it isn’t always that simple. How we should view a monopoly also depends on why the monopoly arose.
Consider oil magnate John D. Rockefeller. His business strategy was to buy up competitors until his company, Standard Oil, controlled most oil in the United States. The result was higher oil prices and enormous profits for Rockefeller — exactly what our theory predicts. Eventually the authorities intervened: in 1911 the Standard Oil monopoly was ordered broken up into 34 smaller companies, and the increased competition led to lower prices for consumers.
In other situations it may actually be desirable that only a single firm serves a market.
There are cases where, in practice, only one firm can operate profitably. We call this a natural monopoly. Imagine when railways were built across the United States in the mid‑1800s. Starting a company offering rail service required huge upfront investments: buying land, clearing forests, building bridges over rivers, tunnelling through mountains, erecting stations — costs in the billions. Is that a good business idea? It can be, but you would have to sell very many tickets. If you sell only 100 tickets a week the revenue will not cover the enormous construction costs. To break even you might need to sell a million tickets a week or even 100 million. In such settings it is “natural” that only one firm serves the market. If the state (in the name of competition) insisted on having, say, 100 competing railway firms, the likely outcome would be no railways at all.
a natural monopoly is a monopoly that exists because costs are much lower if one single firm supplies the entire market; for example, railways
Or consider the market for cancer medicines. Even here a monopoly might be desirable. A finance minister might reason like this:
»Cancer is a tragedy for humanity! I therefore urge firms to develop a vaccine against cancer. Of course I understand this will cost huge sums. You must spend billions on research and face a high risk of failure. The firm that succeeds will indeed earn large profits for a time, but fairly soon other firms will copy the product, driving down prices and profits. I therefore fully understand why you hesitate to invest in developing a cancer vaccine. My offer is this: the firm that succeeds in bringing a vaccine to market will receive monopoly rights for 20 years. No competitor will be allowed to imitate your product. So take the chance! You could become the Rockefeller of your era!«
patent is the right to exclusively use an invention; valid for up to 20 years and only in the countries where it has been granted
A patent gives you the right to be a monopolist for a limited time. This puts us in an ethically tricky situation. For example, many medicines are extremely expensive precisely because a pharmaceutical company holds a patent and thus monopoly power. Should drug companies really be allowed to earn billions by selling outrageously priced AIDS treatments that the world’s poorest cannot afford? At the same time, the medicine might exist only because we created a market in which a single firm could recoup its enormous development costs. What do you think?
7.2 The monopolist shines: Price discrimination
Let’s step into the real world and look for more interesting phenomena. What comes to mind when you see the following examples of pricing?
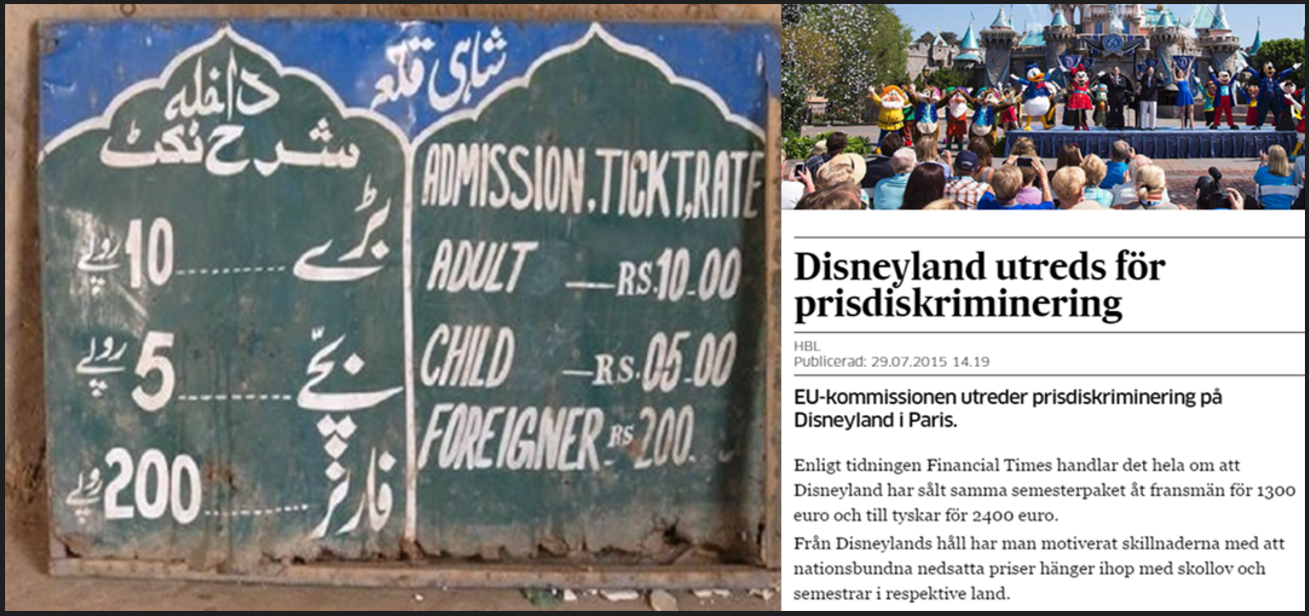
In both cases the same product appears to have two different prices: foreigners are forced to pay more than locals! What on earth is going on?
A first insight is that competition in these markets must be weak. It’s likely we’re dealing with a monopoly. A consequence of monopoly is that the firm can afford to behave badly. The German family at the entrance to Disneyland has no alternative theme park nearby to go to instead. The phenomenon of identical goods being sold at different prices to different kinds of customers is called price discrimination. Below you can see some further examples of suspected price discrimination.
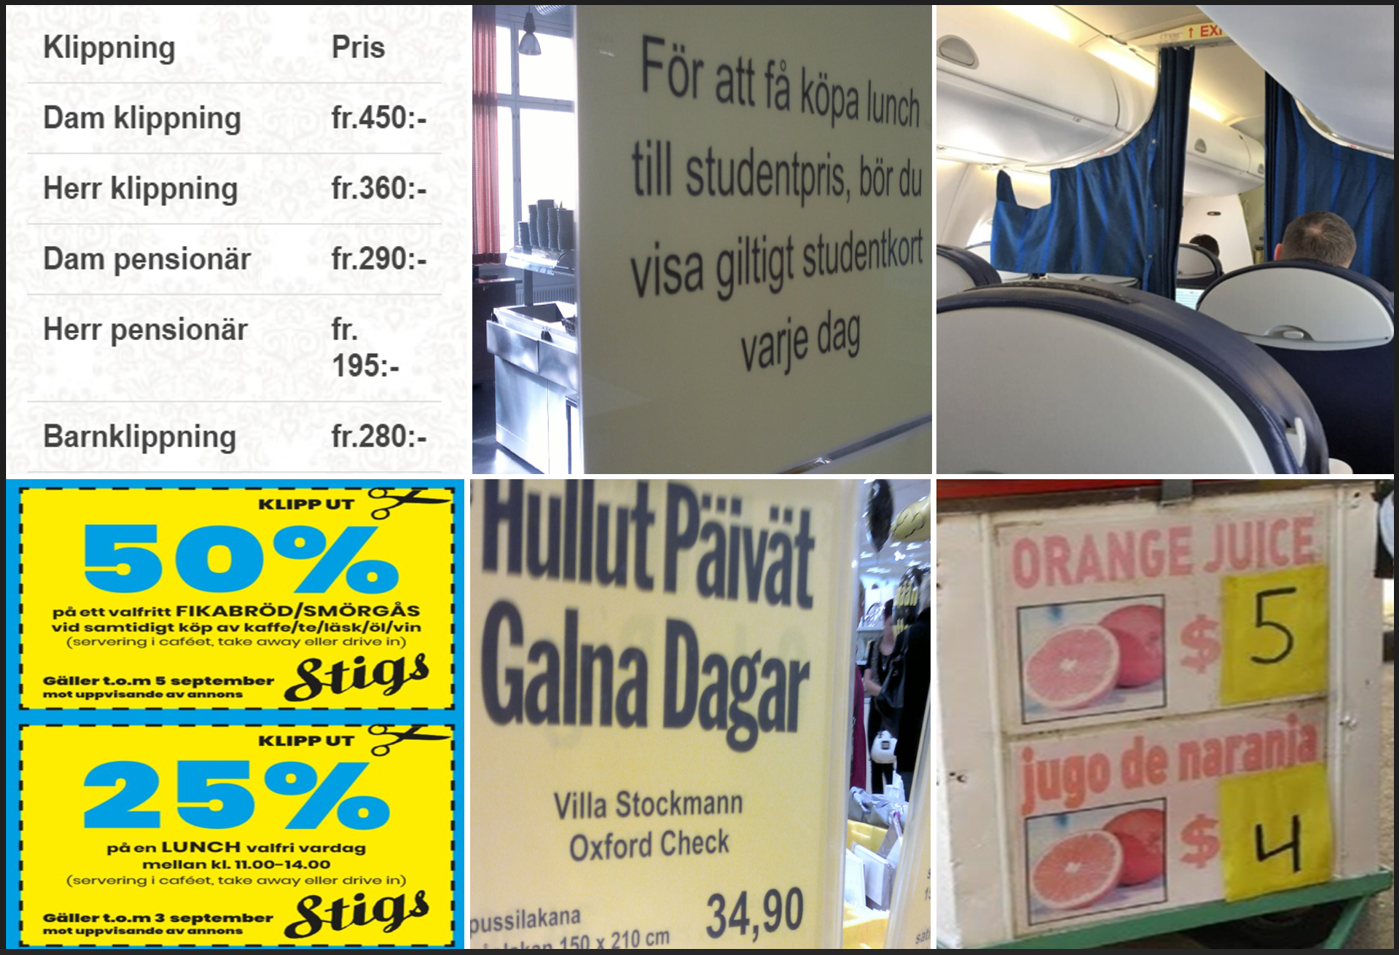
In the small town in northern Sweden the local hairdresser has realised he can increase profits by charging higher prices to customers who are less price‑sensitive. He seems to believe that women and younger people are more willing to pay than men and older customers. When I confronted him about his discriminatory pricing he defended himself by saying the differences are justified because cutting women’s and long hair often takes more work. The dry cleaner offers a similar explanation: laundering women’s shirts allegedly costs almost twice as much as men’s shirts because women’s shirts often have more buttons and details.
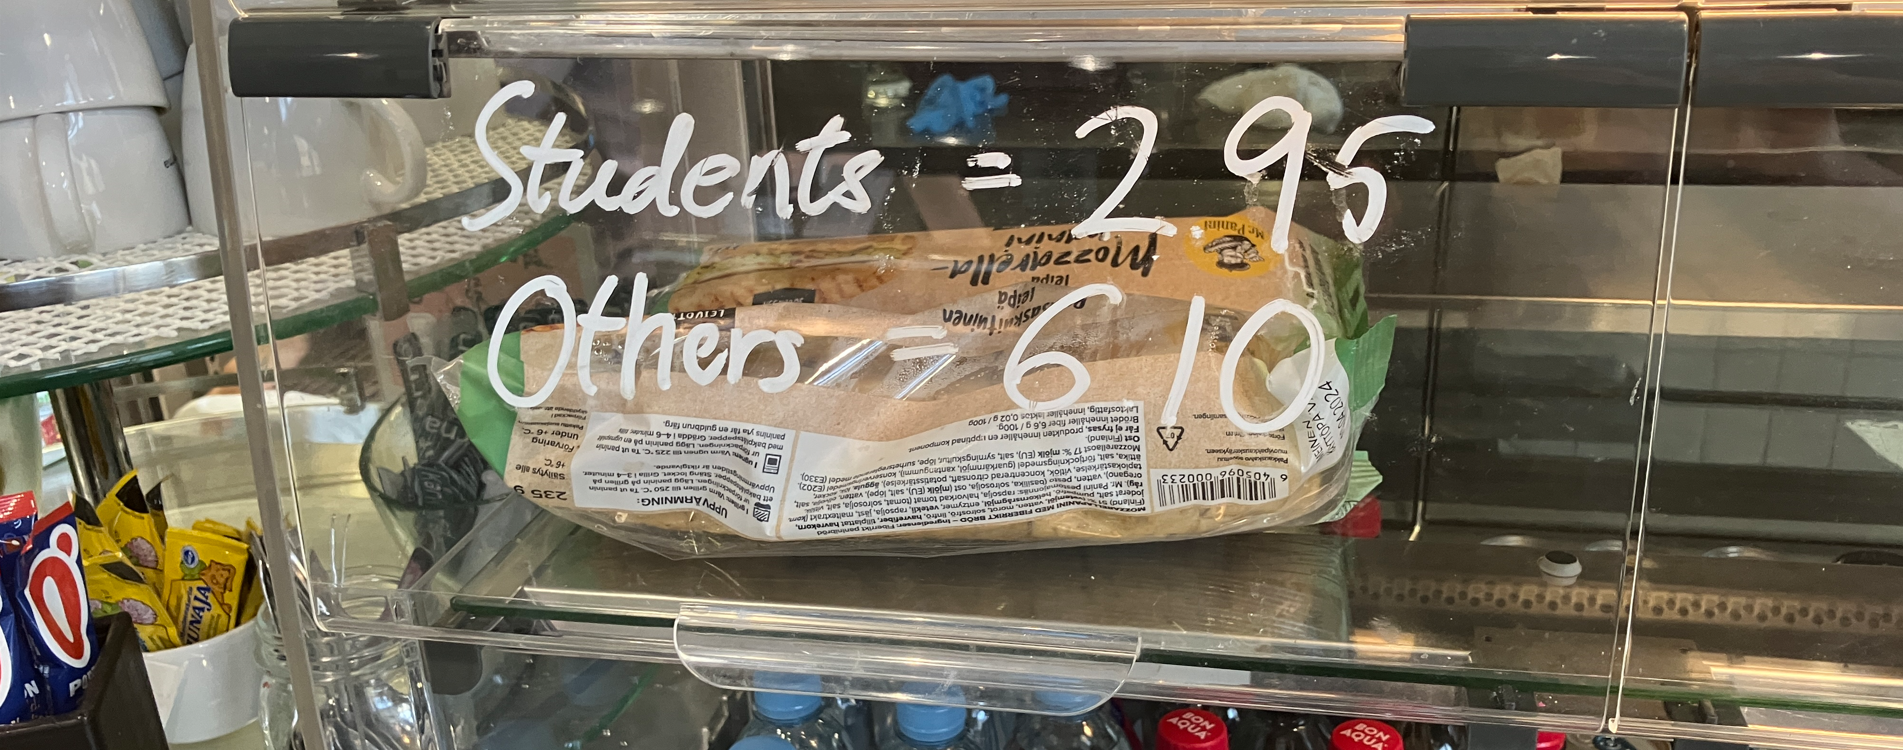
At the student restaurant at Åbo Akademi I see another everyday example of price discrimination. Students pay €3.10 for lunch, while we lecturers pay €7.70 and other guests pay €9.50. Is this a clever pricing strategy — or is there some other reason I pay more for the same meal?
Airline fares are another interesting case of price differentiation. Prices can vary hugely depending on whether you fly business or economy class, even though the difference in service is sometimes modest. Maybe you’ve stood in a checkout and noticed the person in front of you buys the same item at half the price because they brought stacks of discount coupons clipped from flyers they never read? Or you bought an expensive duvet cover at Stockmann yesterday only to see the same item on sale for half price today?
In all these examples customer A pays more for a given product than customer B. It is in many ways a brilliant pricing strategy. Recall when you were CEO of the monopoly Champagne firm. The conclusion in Section 7.1 was to set one higher price than under perfect competition. Here, however, firms appear to set multiple prices for the same product. You can imagine the firm discovering two types of customers: the desperate and the non‑desperate. It seems intuitive that you could increase profit by letting the desperate pay a higher price than the non‑desperate. That is exactly the idea behind price discrimination.
Keep an eye out for price discrimination in everyday life! Take the airline Amapola, which has a monopoly on the Turku–Mariehamn route. With a single price a ticket might cost €400. But customers are not identical: wealthy business travellers are different from poor students. Why not charge willing‑to‑pay customers €700 while students travel for €100? In the exercises at the end of the chapter you will learn more about how to set prices to maximise profits.
Can your firm price‑discriminate — and should it?
In an exercise at the end of Chapter 3 you started a firm in your dream industry. How should you think about price discrimination as a firm owner? Is it good for you to be able to vary the price depending on who the customer is? Of course it can be! If it turns out a single price for everyone is better, you can simply choose not to price‑discriminate. Having the option to price‑discriminate can hardly be a disadvantage.
But can you actually price‑discriminate? Not necessarily. Suppose you grow and sell wheat. The wheat market is perfectly competitive and the market price is €1 per kilo. You now decide to price‑discriminate: ordinary consumers pay €1, but ÅA students should pay €2. Will that work? No. ÅA students have virtually countless other suppliers to buy wheat from. Price discrimination is therefore only possible when you have monopoly power — so customers have nowhere else to go.
Recap: Why is there perfect competition in the wheat market? Because wheat is a homogeneous product, competition among farmers is fierce, and in the long run anyone can become a wheat farmer or exit the industry.
Many firms practise price discrimination. But there is still a pitfall: when the same product has different prices for different types of customers, there is often a risk of arbitrage. Arbitrage means buying where it is cheap and selling where it is expensive. In Sweden, for example, the train company SJ used a system a few years ago where ticket prices were lower if you bought well in advance. Here’s what happened:
arbitrage is buying low and selling high
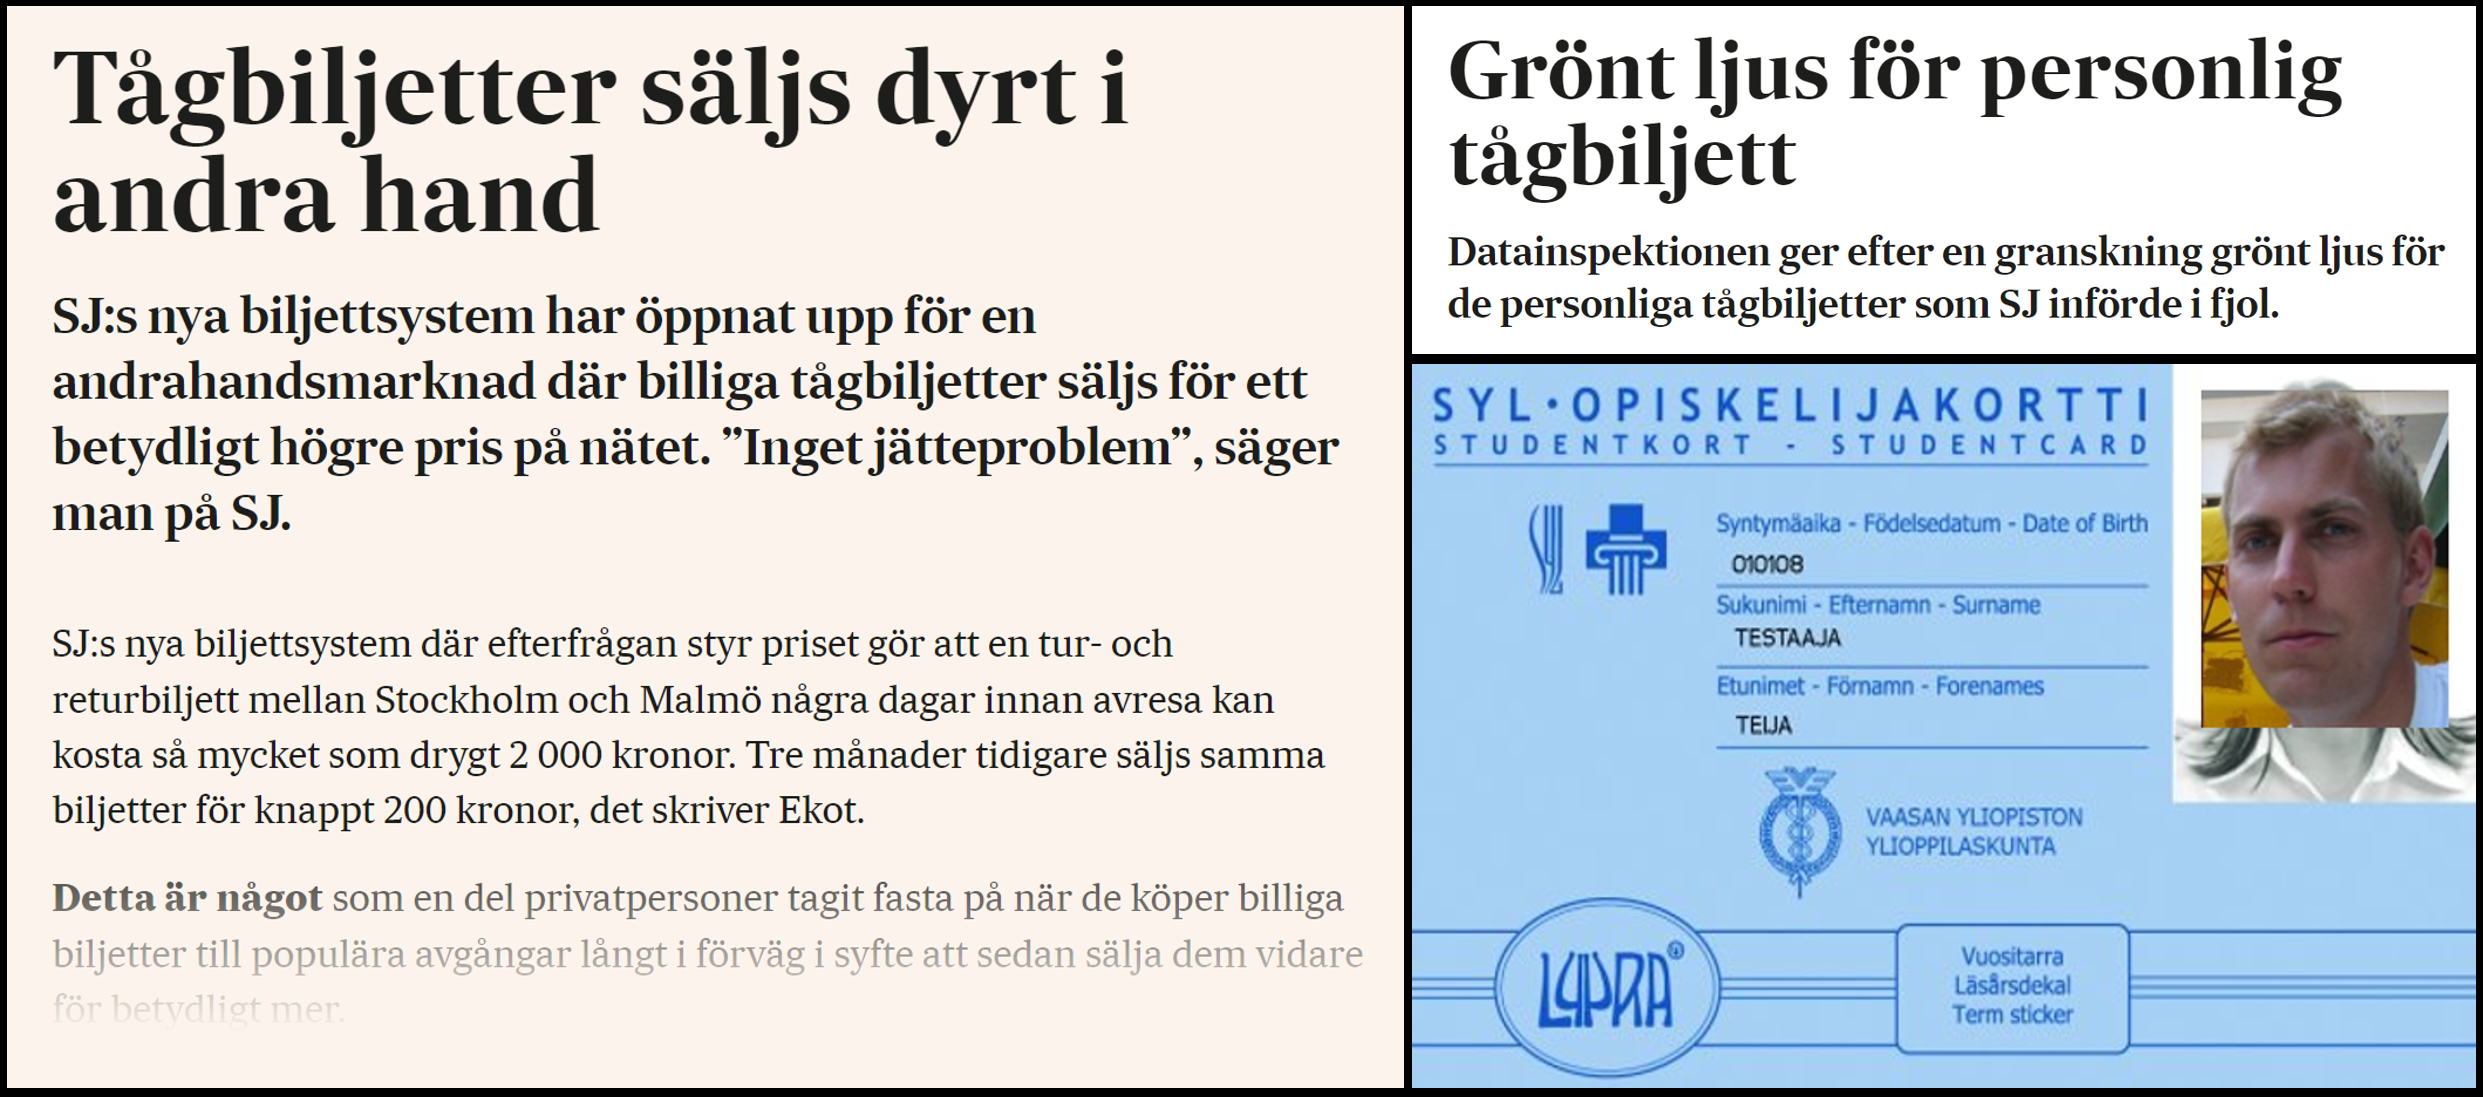
The problem was that the ticket was not personal. The result was that enterprising people bought the cheap advance tickets and then stood on the platforms reselling them to customers at a price below the ticket‑office fare. This kind of resale makes price discrimination difficult. SJ managed to keep the system by making tickets personal and introducing ID checks.
Similarly, think of the student pricing at the Astra canteen. To get the low price you probably have to show your student card. In principle the system could still collapse IF clever students realised they could buy sandwiches for €2.95 and resell them to lecturers for, say, €5. I as a lecturer would be happy because I’d save €1.05, and you as a student would be happy because you’d earn €2.05. Quite soon Astra would probably realise price discrimination was impossible.
How to price tickets for the Glöggrunda?
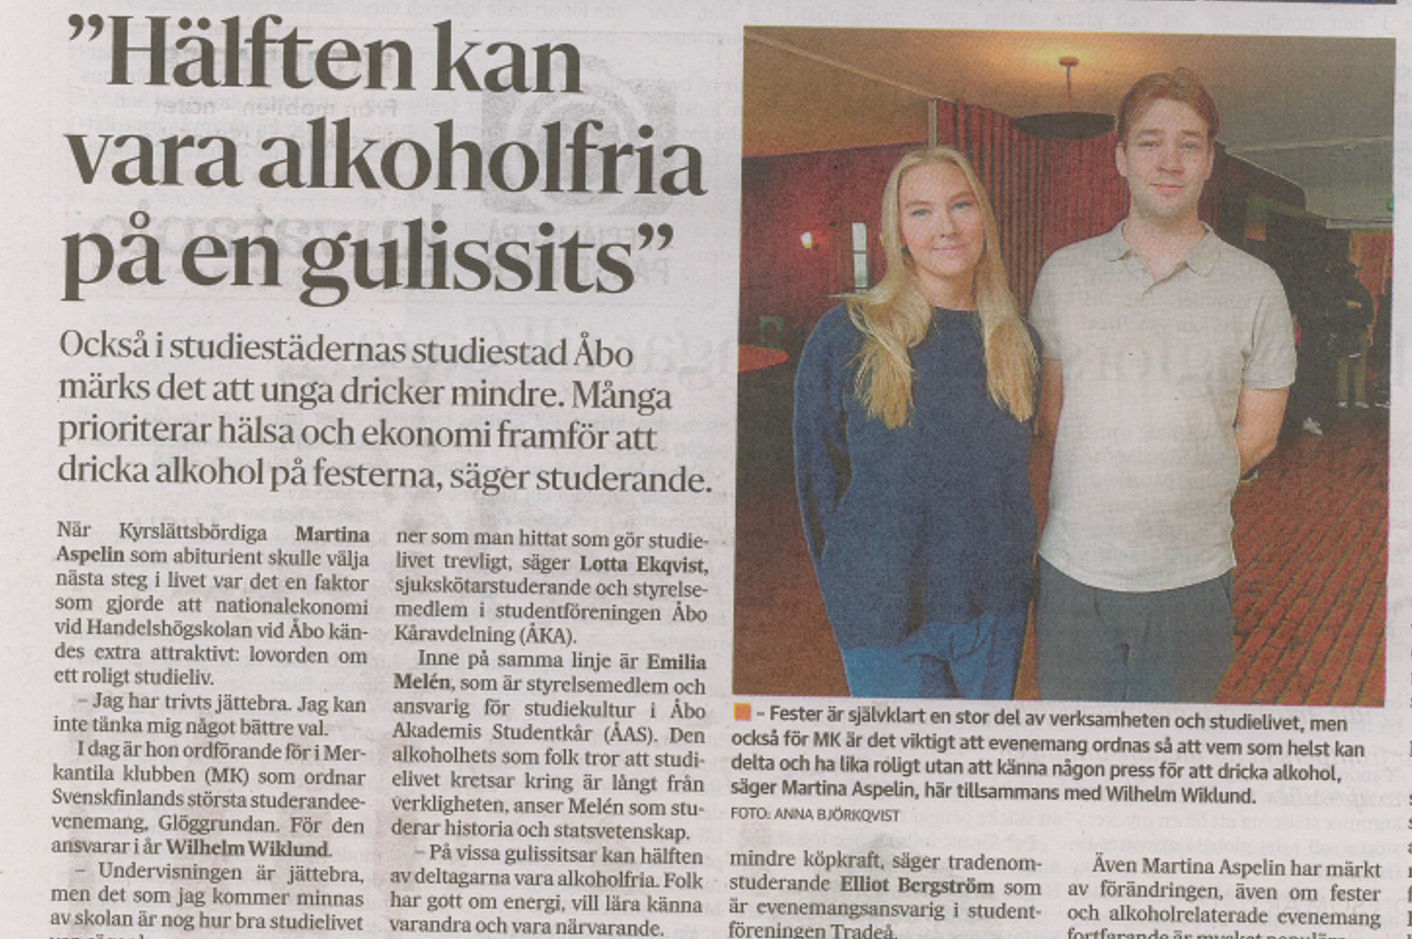
Martina and Wilhelm organised last year’s Glöggrunda in Turku, a large event that attracts thousands of students from all over Finland. Can — and should — they use price discrimination?
First, Martina and Wilhelm are probably price setters. Unlike the wheat farmer — who would lose all customers if they set the price above the market price of €4.50 — Martina and Wilhelm can raise the ticket price without losing all demand. That’s because the product is fairly unique; no one else offers the exact same experience. This lack of competitors means the Merkantila Club can set the ticket price itself. But how high should they set it? One option is to estimate demand and then — like a monopolist — choose the profit‑maximising price for MK. That price might, for example, be €100 per ticket.
But as you now know, it is often possible to increase profit further by price discriminating: charge a higher price (€150?) to students with high willingness to pay and a lower price (€70?) to students with low willingness to pay. Maybe you have noticed that students from Swedish‑language universities have a higher willingness to pay than students from other universities? If so, you could create discounted offers for students from the other universities. You can also let students reveal their own willingness to pay. Imagine there are two types of students: rich and poor. You want to charge the rich more than the poor, but how do you know who is wealthy and who is nearly always broke? You can exploit the coupon trick: someone who bothers to cut out 30 coupons for cheap toilet paper probably has a low willingness to pay. Similarly, Martina and Wilhelm could set up a queuing system: whoever is willing to camp out overnight for the ticket release (thus revealing they are cash‑constrained) pays a lower price than someone who buys online at the last minute.
7.3 Monopolistic competition
I like to think of perfect competition and monopoly as the two extreme market forms. In reality there are other, much more common market types. Let’s, for example, take a look inside the Hansa shopping centre by the Market Square in Turku.

The restaurants sit close together: you can eat at Subway, Itsudemo Sushi, Saigon Corner, Burger King and the Finnish‑Indian Tagin Heritage. What kind of market is this?
It can’t be a monopoly, since many firms compete. But is it perfect competition — like the wheat market or the strawberry stalls? No, because in those cases we assumed the product was homogeneous: Jonte’s strawberries were essentially identical to the other sellers’ strawberries. In the Hansa shopping centre the food is instead differentiated: a Chinese beef‑and‑vegetable wok with cashews is clearly a different product from a Double BBQ Cheese Meal.
monopolistic competition is when firms sell different varieties of goods and services and can therefore set their own prices; examples include restaurants, clothing brands, hotels, films, music, books, and petrol stations along the highway.
Why do markets of this type arise, where each firm niches and creates its own product variant? Imagine you are about to open a restaurant in the Hansa quarter. How should you act? One insight is that competition is unpleasant for you as a firm owner. The fact that your customers can buy the same food at another restaurant is bad news for you. That’s good for society overall — competition tends to produce lower prices — but as a firm you want to maximise profits. So how do you get rid of your competitors?
One option is to “collude” with them, e.g. by buying them out (like Rockefeller) or forming a cartel (like the drug gangs in South America) — but with dozens of restaurants in the neighbourhood this is hardly realistic.
A more realistic option is to make your product different from the competitors’. You could, for example, niche down to serve only Nepalese food. That would give you a kind of monopoly on Nepalese dishes. All demand for Nepalese food in the area would then be demand for your food — because you are the only restaurant nearby offering that cuisine. Hungry customers who really want momo (steamed dumplings filled with buffalo meat) have nowhere else to go. You can therefore, like a monopolist, charge high prices and earn large profits.
Note, however, there is an important difference compared with monopoly. A monopoly market is characterised by entry barriers: new firms can never enter the market. That allows the monopolist to earn large profits even in the long run. Under monopolistic competition, by contrast, entry and exit are free in the long run. That means the large profits of restaurants will attract new entrants to the neighbourhood; soon there will be Tibetan, Indian, Chinese and Indonesian restaurants as well. New entrants offering new varieties are bad news for your Nepalese restaurant because some of your customers will be tempted by the new options. In practice this means demand for your food will fall over time, so you can no longer charge as high a price as before and your profits will decline.
Monopolistic competition is a very common market form. Look, for example, at the cereal aisle in the supermarket. There is a cornucopia of different varieties. Is that good or bad?
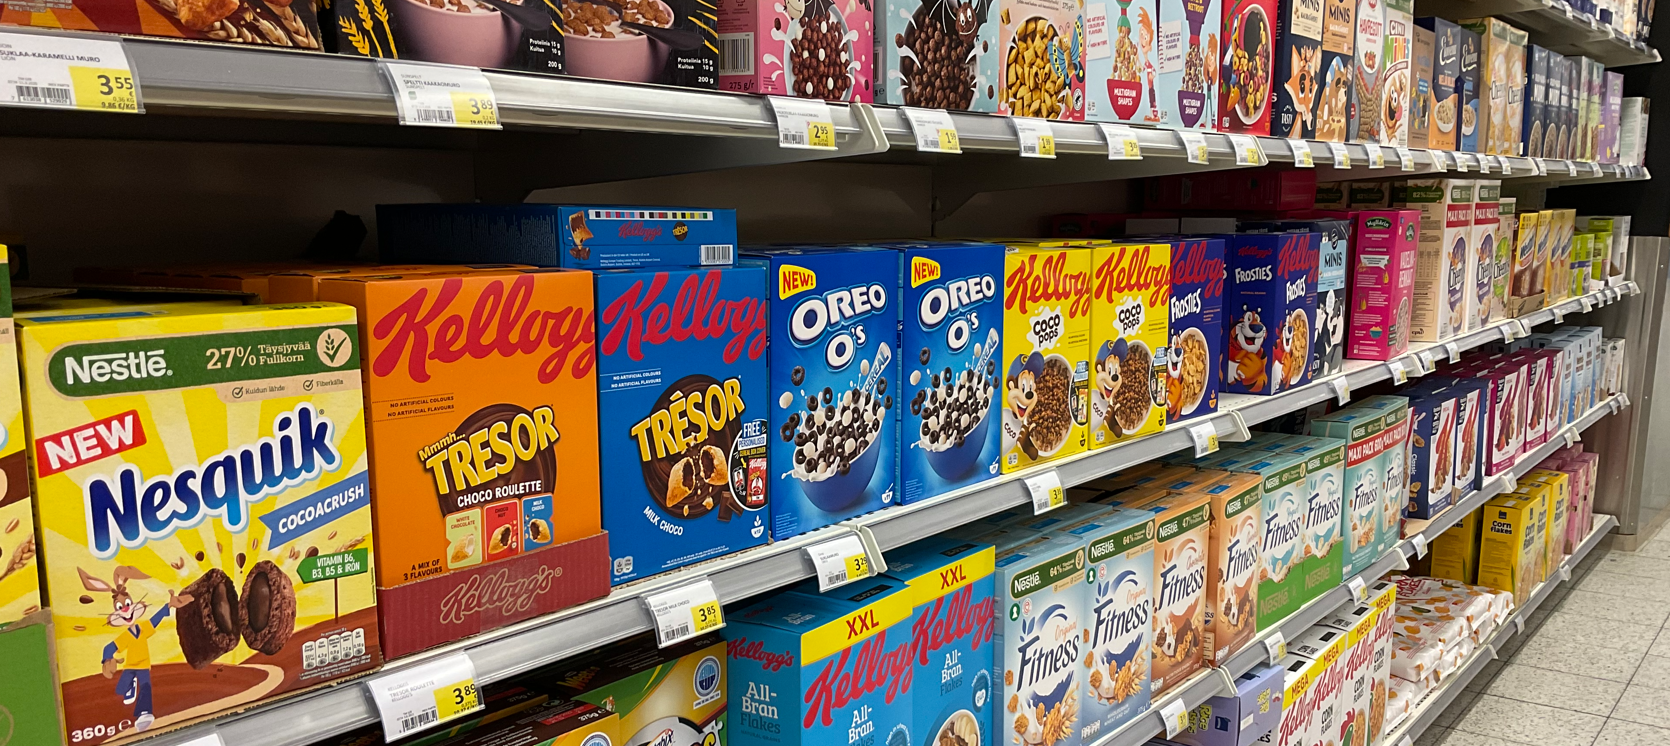
Firms niche to earn large short‑term profits. Each firm obtaining a monopoly‑like position — there are customers who must have a particular cereal flavour — makes things somewhat unnecessarily expensive. On the other hand, product differentiation creates a cornucopia of varieties, increasing the chance you’ll find a cereal that fits you perfectly.
There are also other ways to niche than by creating a genuinely unique product. You can persuade people that your product is unique even if it isn’t. With clever marketing consumers can be convinced of uniqueness, allowing firms to charge high prices and earn large profits at least in the short run. In the clip below you can see how Don Draper in the TV series Mad Men finds a clever way to help the cigarette brand Lucky Strike. An extract from the real advertising campaign is shown at right.
Don Draper uses clever marketing to create billion‑dollar profits for his client.
Understanding monopolistic competition is not simple. You must therefore work through all the exercise questions at the end of the chapter on your own. There you will be tested on exactly the kinds of problems you need to master to pass the course exam. If you need further help, here are two old video clips where I explain monopolistic competition:
Finally: let’s tie a few threads together. In the previous chapter we learned that the market is right about WHAT, HOW and FOR WHOM. That is a remarkable achievement, but note that this holds fully only under perfect competition. If sellers and buyers do not meet on equal terms, the quantity produced will not be the socially optimal one. A summary of the three market types is shown in the table below:
| Perfect competition | Monopolistic competition | Monopoly |
|---|---|---|
| Many sellers, each with a small share of the market | Many sellers, each with a small share of the market | One seller |
| Good perceived as identical | Goods perceived as differentiated | Good perceived as identical |
| Free entry and exit in the long run | Free entry and exit in the long run | Entry barriers |
| ➩ Optimal quantity, no large profits | ➩ Too little quantity, expensive, large profits only in the short run, many varieties | ➩ Too little quantity, expensive, large profits also in the long run |
7.4 Monopsony: No competition among buyers
Just as there are markets with only a single seller (monopoly), there are situations where there is only a single buyer. Markets with only one buyer are called monopsonies. What happens in such cases?
When I think of monopsony I always picture “the Blueberry King” in the Åshöjden novels — the story of a tiny village whose poor football team suddenly rockets up the league tables. Almost everything in Åshöjden is owned by the Blueberry King and almost everyone works at the sawmill. If you live in Åshöjden, the Blueberry King is basically your only chance of getting a job. In short: the labour market in Åshöjden is characterised by monopsony.
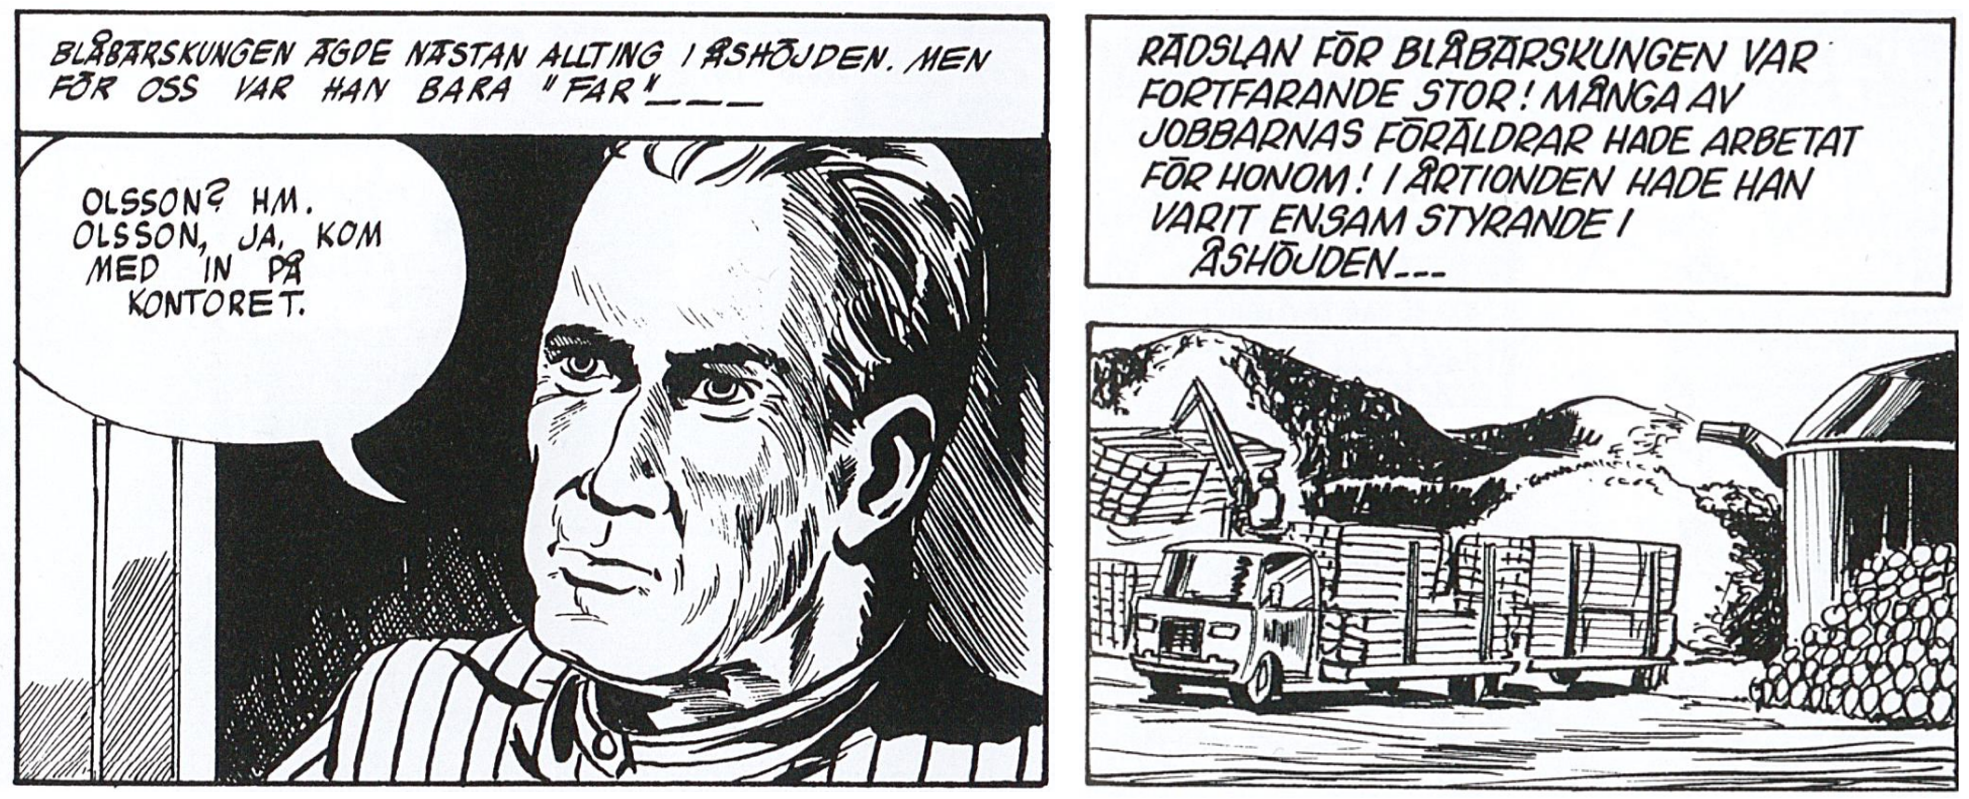
How do you think this kind of market affects life in Åshöjden? Is it good or bad for the Blueberry King that he is the only employer? Would it be better for you as a jobseeker if there were more firms in Åshöjden competing to hire you?
Think like this: if there are many firms, workers can play firms off against each other. Competition for labour is fierce and forces firms to pay the highest wages they can afford. If one firm offers worse pay, no one will work there and they’ll go to rivals offering better terms. Wages are thus bid up to the point where each firm is barely able to survive; wages higher than that would bankrupt firms. But what happens under monopsony?
Imagine the labour supply curve shows how much workers are willing to work at different wages. Because the Blueberry King is the sole buyer of labour, the curve now shows how much workers are willing to work for the Blueberry King — he is the whole local labour market. The absence of competition means the Blueberry King can choose where on the supply curve to hire: he can hire few workers at low pay (e.g. 10 workers at €15/hr) or many at high pay (e.g. 70 workers at €45/hr). What is the profit‑maximising choice? The answer is that the Blueberry King will set the wage somewhere along the thick blue curve in Figure 7.1. Do you see why?
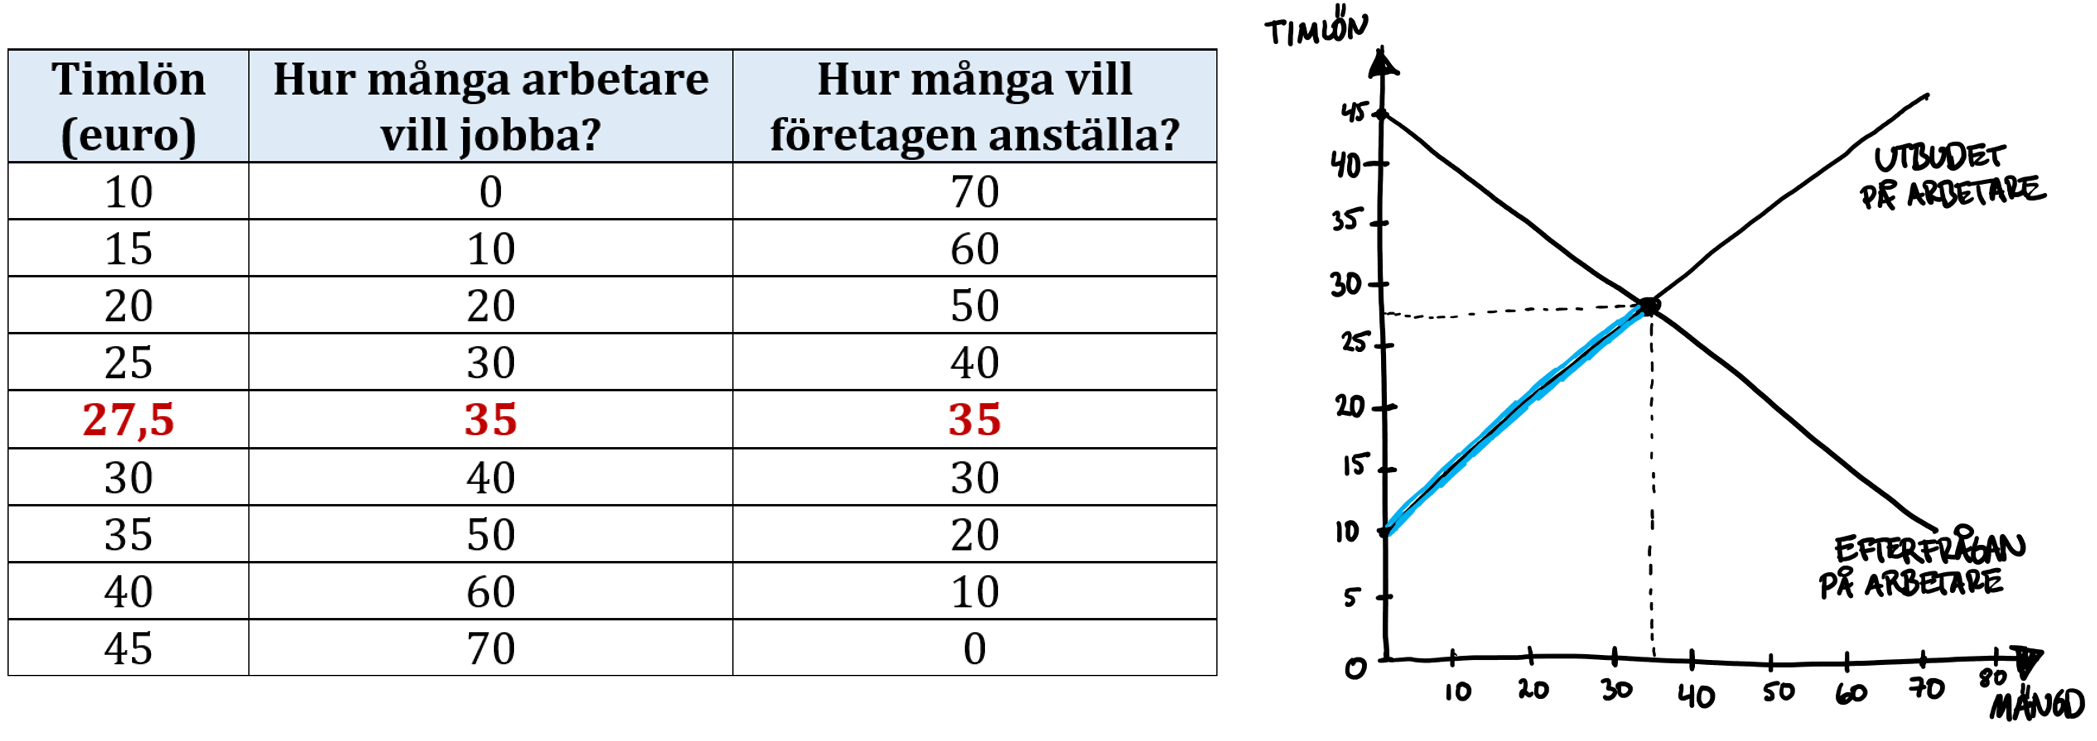
The Blueberry King will not set the wage at €27.50 or higher — that was the level where fierce competition nearly drove him under. Nor will he set the wage at €10 or lower — then nobody would work. The monopsony wage will therefore lie somewhere between about €10.01 and €27.49. At such a low wage fewer people will work compared with the perfectly competitive outcome.
Our conclusions about monopsony in the labour market are therefore: the Blueberry King grows fabulously rich, you as a worker receive a poor wage, and Åshöjden as a community would be better off with more competition in the labour market.
How common is monopsony in labour markets? Some argue that many young people are effectively at the mercy of fast‑food employers, especially in small towns. Others have argued that one reason for gender wage gaps is that many women work in care sectors where the public employer has often been the only realistic option — which may have contributed to generally lower wages for women than for men.
Essay tip:
In 2025 women’s wages in Sweden averaged about 90% of men’s (source here). To what extent does the gender pay gap reflect that women are more often employed in the public sector? What happens to wages within an industry or in a locality if suddenly more employers appear to hire from the same labour pool?

Exercises
In this chapter you learned why markets fail when someone becomes too powerful. This lack of competition allows the powerful to grab surplus at the expense of the weak — which usually harms society as a whole. Below are some cases where you can apply your knowledge in practice. Press Show Answers when you want the computer to grade your responses. Good luck!
Preseason training
First you’ll drill a few exercises so you feel confident with the techniques. Practice until you can do all the problems without peeking at the answers. Then you’ll be ready to move on to more applied tasks. Good luck!

- A market with a single seller is called and a market with a single buyer is called .
- When a market goes from perfect competition to monopoly the price becomes , sales become , the firm’s profits become and the deadweight loss becomes .
- In a monopoly the demand curve is given by \(\small P_D=500-5Q\). What is MR?
- In a monopoly the demand curve is given by \(\small P_D=100-2Q\). What is MR? .
- In a monopoly \(\small P_D=500-5Q\). Total revenue is \(\small TR=P\cdot Q=(500-5Q)Q=500Q-5Q^2\). Marginal revenue MR is the derivative of total revenue TR with respect to Q. What is MR? .
- For a monopolist \(\small TR=100Q-2Q^2\). What is MR? . 7.For a monopolist \(\small TR=250Q-4Q^2\). What is MR? .
- You are CEO of Wärtsilä, which among other things makes diesel engines. Suppose Wärtsilä has a monopoly on diesel engines. Demand is \(\small Q_D=25{,}000-100P\), where Q is engines per month and P is price in euros. Marginal cost MC is constant at €50 per engine. Fixed costs are €100,000 per month. The profit‑maximising quantity is , the market price will be , and monthly profit will be euros.
- Read the chapter.
- Read the chapter.
- Remember: the MR curve shares the demand curve’s intercept but has twice the slope.
- Remember: the MR curve shares the demand curve’s intercept but has twice the slope.
- Here you learn why MR has the same intercept as demand but double the slope. MR is simply the derivative of TR with respect to Q: how revenue changes at the margin when you sell a little more. Review Chapter 6 if you’re unsure about differentiation.
- What is the derivative of TR with respect to Q? (Differentiate the total‑revenue function.)
- What is the derivative of TR with respect to Q? (Differentiate the total‑revenue function.)
- First obtain the inverse demand: \(\small P_D=250-0,01Q\). Then \(\small MR=250-0,02Q\). A profit‑maximising firm produces where MR = MC, so solve 250 − 0.02Q = 50 for Q. Use \(\small P_D=250-0,01Q\) to find the price. Finally compute profit = total revenue − total cost, where total revenue = P × Q and total cost = fixed costs (100,000) + variable cost (50 × Q).
Monopoly in the veterinary market
In 2021 Evidensia acquired its competitor Omaeläinkliniikka. As a result, many small towns in Finland now effectively have a monopoly on veterinary services.

- How will the shift to monopoly affect the price of neutering a dog?
- What is it called when only a single firm can practically operate in a market?
- Which of the following firms is most likely a natural monopoly?
- You are the only veterinarian in Porvoo. Demand for dog neuterings is given by \(\small Q_D=125-0,5P\), where Q is the number of neuterings per month and P is the price in euros. Your marginal cost of performing a neutering is constant at €50 per operation. You also have fixed monthly rent of €2,000. What is your monthly profit?
- Write down, for yourself, three examples of why monopolies arise.
- Patents make AIDS medicines extremely expensive. Do you think patents for AIDS medicines are wrong?
- Read the chapter.
- Read the chapter.
- Read the chapter.
- Derive the inverse demand. From that you can obtain the MR curve (remember: same intercept as demand but twice the slope). Set MR = MC and solve for the quantity that satisfies this equality. Use the demand curve to read off the price you should charge for a neutering at that quantity. Finally compute total revenue and subtract total costs to get profit. Note that total cost equals fixed rent plus the number of neuterings times the marginal cost per neutering.
- Why does a firm end up alone in a market? Several common mechanisms: a) The firm may control a unique resource. For example, De Beers historically held de facto control over the world’s diamond mines, giving it monopolistic power (see Wikipedia); b) The firm may hold patent protection that legally prevents rivals from copying the product, c) The market may be a natural monopoly, where costs are so much lower if a single firm serves the entire market (very large fixed costs and strong economies of scale); d) Network effects can create monopolies: when the value of a product grows with the number of users (think Facebook, TikTok), the first mover tends to become dominant and it becomes nearly impossible for a new entrant to displace the incumbent even if the entrant’s product is technically superior. The same dynamic occurred in the 1980s with VHS: because everyone used VHS, it was effectively impossible for rivals to enter.
- Practice arguing from economic theory. Structure your answer clearly: what are the benefits of patents (e.g. stronger incentives to invest in R&D, easier to recoup large upfront costs) and what are the downsides (e.g. temporary monopoly pricing, reduced access and higher prices for consumers)? Explain both sides and weigh the trade‑offs.
How John Rockefeller made $318 billion
Oil magnate John D. Rockefeller is one of the wealthiest people in history. In this exercise you will get to know the oil industry more closely.
- Assume US demand for oil is given by \(\small Q_D=100{,}000-1{,}000P\), where Q is the number of barrels and P is dollars per barrel. Standard Oil’s costs are given by \(\small TC=50{,}000+10Q+0{.}0005Q^2\). Assume Standard Oil effectively has a monopoly on oil. The output that maximises Standard Oil’s profit is , the price per barrel will be , and the firm’s profit will be .
- The short film below shows how Standard Oil became a hugely successful company. How did the US authorities ultimately deal with Standard Oil?
- A tip is to draw the diagram (at least until you’re fully comfortable with these problems). The inverse demand is \(\small P_D=100-0.001Q\), which implies \(\small MR=100-0.002Q\). Remember the rule: the MR curve shares the demand curve’s intercept but has twice the slope. Want to know why? Total revenue is price times quantity: \(\small TR=P*Q=(100-0.001Q)*Q\)=\(\small 100Q-0.001Q^2\). MR is the derivative of TR with respect to Q, which yields \(\small MR=100-0.002Q\).. Now set MR = MC to find the output that maximises profit. You can then read off the price Standard Oil can charge at that output, compute total revenue (price × quantity) and total cost, and subtract costs from revenue to get profit.
- Watch the film.
Monopoly in the student underworld
During my student days in Uppsala a friend, here called “Mr X”, ran an illegal production of a small device you could plug into your TV to watch all pay channels without paying. Mr X was the only person selling these devices in Uppsala’s underworld. Assume annual demand for the device was \(\small Q_D=400-2P\), where Q is the number of devices and P is the price per device in euros, and that each device cost €20 to produce. Mr X also had fixed annual costs of €500 (for example to buy a soldering iron).

- How much profit did Mr X make from his operation each year? Answer: .
- In this case the monopoly arose because Mr X was the only person with the technical skills to build the device. Give three additional examples of why monopolies arise.
- In practice demand for the device likely differed across student groups, e.g. between men and women. Explain how Mr X could have used price discrimination and how that would have affected his profits.
- What three criteria must be satisfied for price discrimination to be possible? Do you think these assumptions hold in this case?
- From the information in the question you know: TC = 500 + 20Q; MC = 20; P_D = 200 − 0.5Q; MR = 200 − Q. Set MR = MC to get the profit‑maximising quantity Q = 180. Plug that Q into P_D = 200 − 0.5Q to find the price: P = €110 per device. Profit = total revenue − total cost. Do you get the same result now?
- See question 5 in Monopoly in the veterinary market.
- Treat men and women as separate markets. Estimate demand among men and demand among women separately, then set the monopoly price for each group. This lets you charge a higher price to the group with the higher willingness to pay and a lower price to the group with the lower willingness to pay. That will probably raise profit (and if it doesn’t, you can always revert to a single price).
- Three conditions for price discrimination: you must be a price setter (able to raise price without losing all customers); arbitrage (resale) must be prevented; and you must be able to identify or screen customers into groups with different willingness to pay (you must know which group an individual belongs to, and you cannot rely on them truthfully telling you). In the Uppsala device case arbitrage is likely a problem: why would a male student buy the device himself when he can have a female friend buy it cheaper and hand it over?
Price discrimination
As the marketing director for Finnkino you are responsible for setting ticket prices that maximise the company’s profit. Assume Finnkino has a monopoly on the cinema market in Turku. You therefore decide to price‑discriminate so that ticket prices vary over the day. Your measurements show that annual demand for matinee visits is \(\small Q_D=50{,}000-5{,}000P\), where Q is the number of tickets and P is the ticket price in euros, while evening demand is \(\small Q_D=80{,}000-4{,}000P\). Marginal cost per ticket is constant at €1. The firm’s fixed cost is the cinema rent of €54,000 per year.

- What should the ticket price be during matinees? Answer:
- What should the ticket price be during evenings? Answer:
- Compute and enter Finnkino’s annual profit: .
- What is the economic term for “buying cheap and selling dear,” a potential threat to maintaining this kind of pricing?
- Treat this as two separate markets where you are a monopolist in each. Start with matinees. Invert \(\small Q_D=50{,}000-5{,}000P\) to get \(\small P_D=10-0.0002Q\), which implies \(\small MR=10-0.0004Q\). Set MR = MC (so 10 − 0.0004Q = 1) to find that Q for the matinee should be 22,500. Use \(\small P_D=10-0.0002Q\) to determine the matinee price.
- Use the same method to find the evening price.
- Here’s a practical tip: proceed carefully — it’s easy to make a mistake. First compute total revenue. You sell 22,500 matinee tickets at €5.50 and 38,000 evening tickets at €10.50, so total revenue = €522,750. Next compute total costs. Variable cost is €1 per ticket; with 60,500 tickets total variable cost = €60,500. Add fixed rent €54,000. Total cost = €114,500. Profit = total revenue − total cost.
- Review Section 7.2.
Monopolistic competition
The year is 1961. You are the head of an advertising agency on Madison Avenue in New York. One of your clients is the tobacco company Lucky Strike. Competition on the cigarette market is fierce; competitors to Lucky Strike include Blend, Camel, John Silver, L&M, Marlboro, North State, Pall Mall and Prince. In practice all the brands taste much the same, but at your last meeting you came up with a brilliant idea.
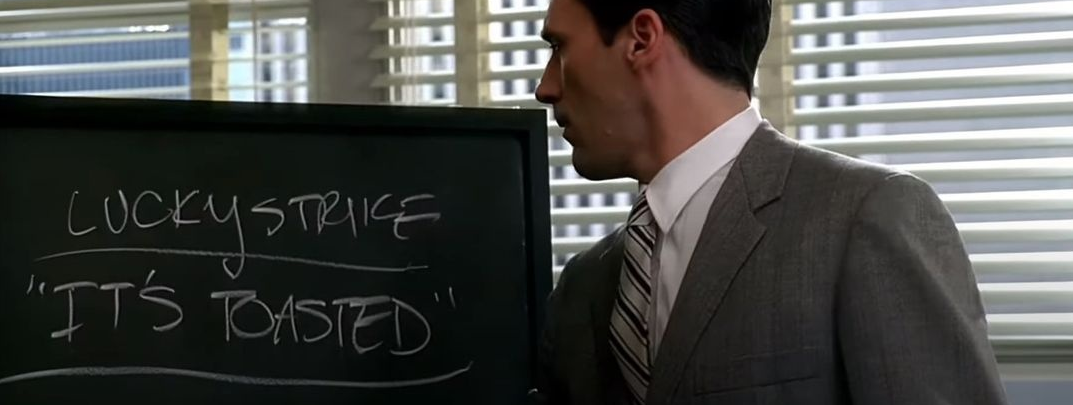
- Using your slogan “It’s toasted!” you want consumers to believe Lucky Strike is different from all other cigarettes. Through this product differentiation you will be able to raise the price without all customers fleeing to competitors. Explain in simple terms to Lucky Strike’s representatives how this will affect their short‑run profit.
- What happens in the market in the long run? Explain in simple words.
- In many markets firms earn zero economic profit in the long run. Why do firms still continue to operate despite zero economic profit?
- Lucky Strike does not want only words — they want numbers. You deliver cigarettes to shops in large boxes, each containing roughly 100 packs. Fortunately you have the following facts: \(\small P_D=100-0.00125Q\), \(\small MC=10+0.0075Q\) och \(\small TC=105{,}000+10Q+0.00375Q^2\), where Q is the number of boxes per month and P is the price in dollars per box. What price should Lucky Strike set per box if they want to maximise profit? Answer: .
- How large will Lucky Strike’s short‑run monthly profit be if they follow your recommendation? Answer: .
- Product differentiation is extremely common in practice. For example, my store stocks 34 varieties of toothpaste. Is this good or bad for the customer? Argue your position.
- Thanks to my slogan “It’s toasted!” I become a price setter. You can think that I brainwashed consumers into believing Lucky Strike is a unique product with no close substitutes. This allows me to raise the price without all customers switching to Blend, Camel or another brand. That’s why I can earn large short‑run profits.
- The cigarette market will now consist of many differentiated brands, each niching toward a segment of consumers. Blend may appeal to older women, Marlboro to “cowboys”, Prince to the young urban crowd. All firms earn large short‑run profits. But those profits will attract new entrants over time — Kent, Barclay, Kool and Carlton may arrive. Some entrants will be close substitutes for Lucky Strike in certain customer segments, reducing demand for Lucky Strike, which in turn lowers the price and reduces profits. That is the long‑run effect.
- Think of total costs as capturing all the firm’s costs. That includes wages for employees and the return to you as owner. Long‑run economic profit equal to zero means employees and owner get a normal wage and normal return, but nothing “extra.” For example, if wheat farmers earn €3,000/month while oat farmers earn €8,000/month, in the long run some wheat farmers will switch to oats, equalising pay across sectors. Zero economic profit simply means “accounting profit” is the same everywhere once normal returns are included.
- Solve the pricing problem as a monopoly problem. Derive MR from the demand curve (remember: MR shares demand’s intercept and has twice the slope). Set MR = MC to find the profit‑maximising quantity, then use inverse demand to read off the price.
- First compute total revenue (e.g. 9,000 boxes × €88.75 per box). Then compute total cost by plugging the quantity into TC. Profit equals total revenue minus total cost.
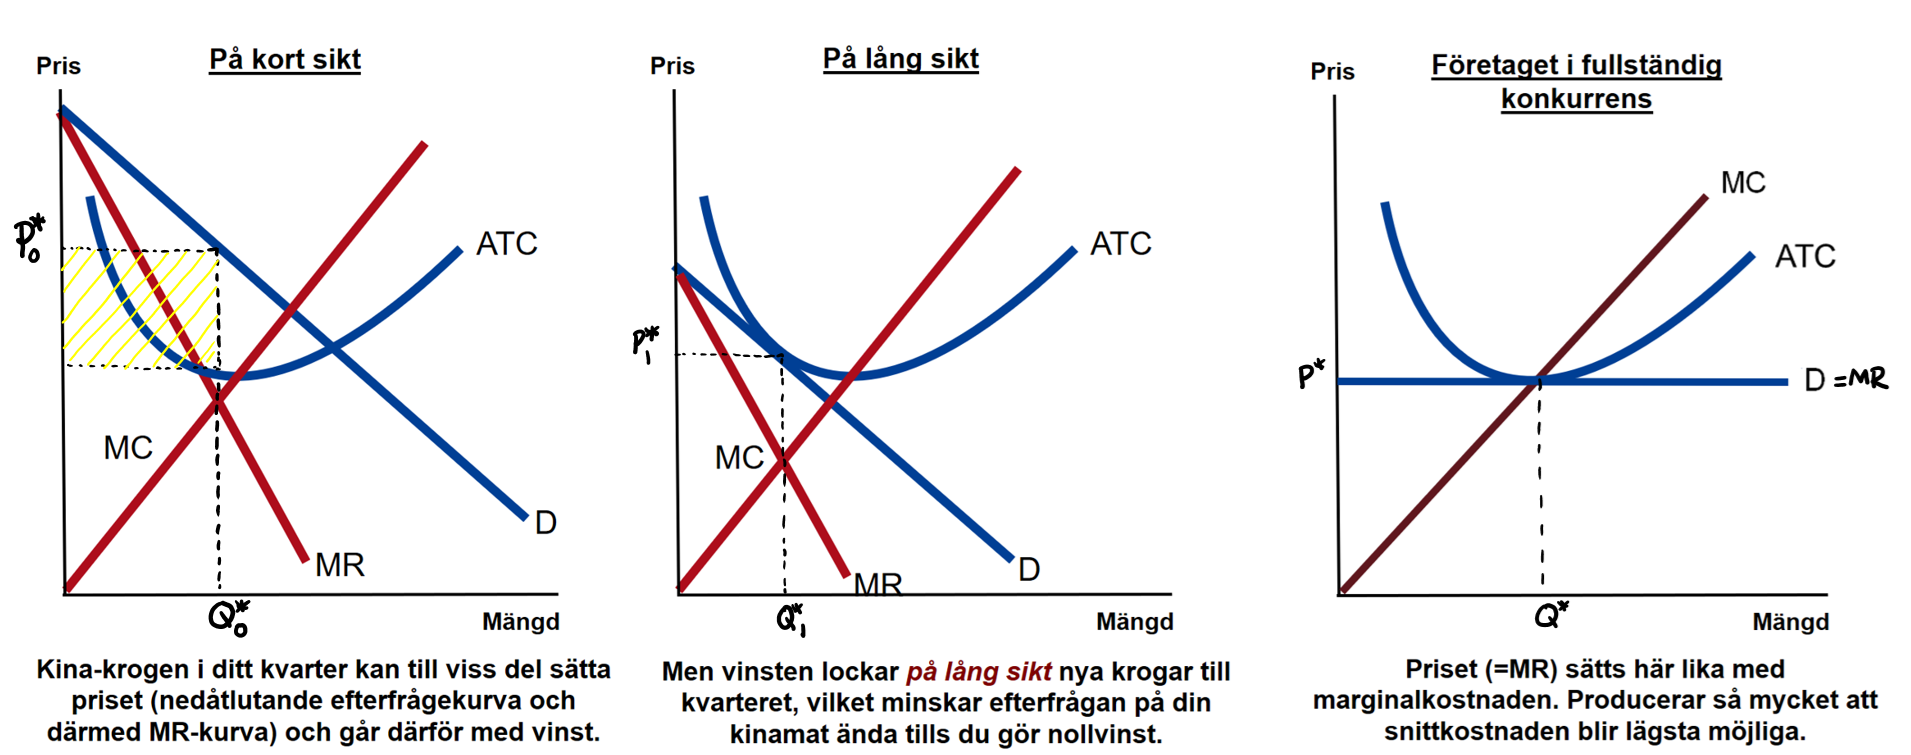
- Are 25 cigarette brands and 34 toothpaste varieties good or bad? Look at the figure below. On the left you see monopolistic competition in the short run: firms set high prices and earn large profits. In the middle you see the long run after entry: so many new cigarette or toothpaste producers have entered that each firm earns zero profit (so no further entry occurs). Note that this long‑run situation is not socially optimal: each firm produces “too little” — one more unit would be valued more by consumers than it costs to produce. On the right you see what it would look like if differentiation were impossible: a market of identical products with many firms, i.e. perfect competition. Do you see the difference? Monopolistic competition yields many firms each charging a bit too high a price (they have “local monopoly” in their niche) and producing too little. These drawbacks must be weighed against the benefit: a wider variety of products. As a consumer you may well appreciate many cereal varieties rather than only one.
Walmart conquers the world
Walmart is an American retail chain with 11,400 stores and 2.1 million employees. Critics argue the chain is so dominant that it is effectively the only realistic employer in many towns, especially for people without higher education. This could explain both why workers in those areas earn such low wages and why Walmart earns such large profits.

- Explain in plain language why monopsony in the labour market leads to lower wages and fewer jobs.
- Give three examples of occupations in Finland that operate in labour markets likely characterised by monopsony.
- Illustrate this labour market in a diagram with wage on the vertical axis and number of workers on the horizontal axis. Draw a labour supply curve and a labour demand curve. Show in the figure the wage under perfect competition and the wage under monopsony.
- Workers have only one firm to sell their labour to, so the firm can get away with paying very low wages. The workers have nowhere else to go. And at a low wage fewer people are willing to work.
- Perhaps teachers, healthcare staff and shop assistants in small towns; the local school, hospital and country store may be the only employer for these groups. This could, in turn, help explain why these groups may receive relatively low pay.
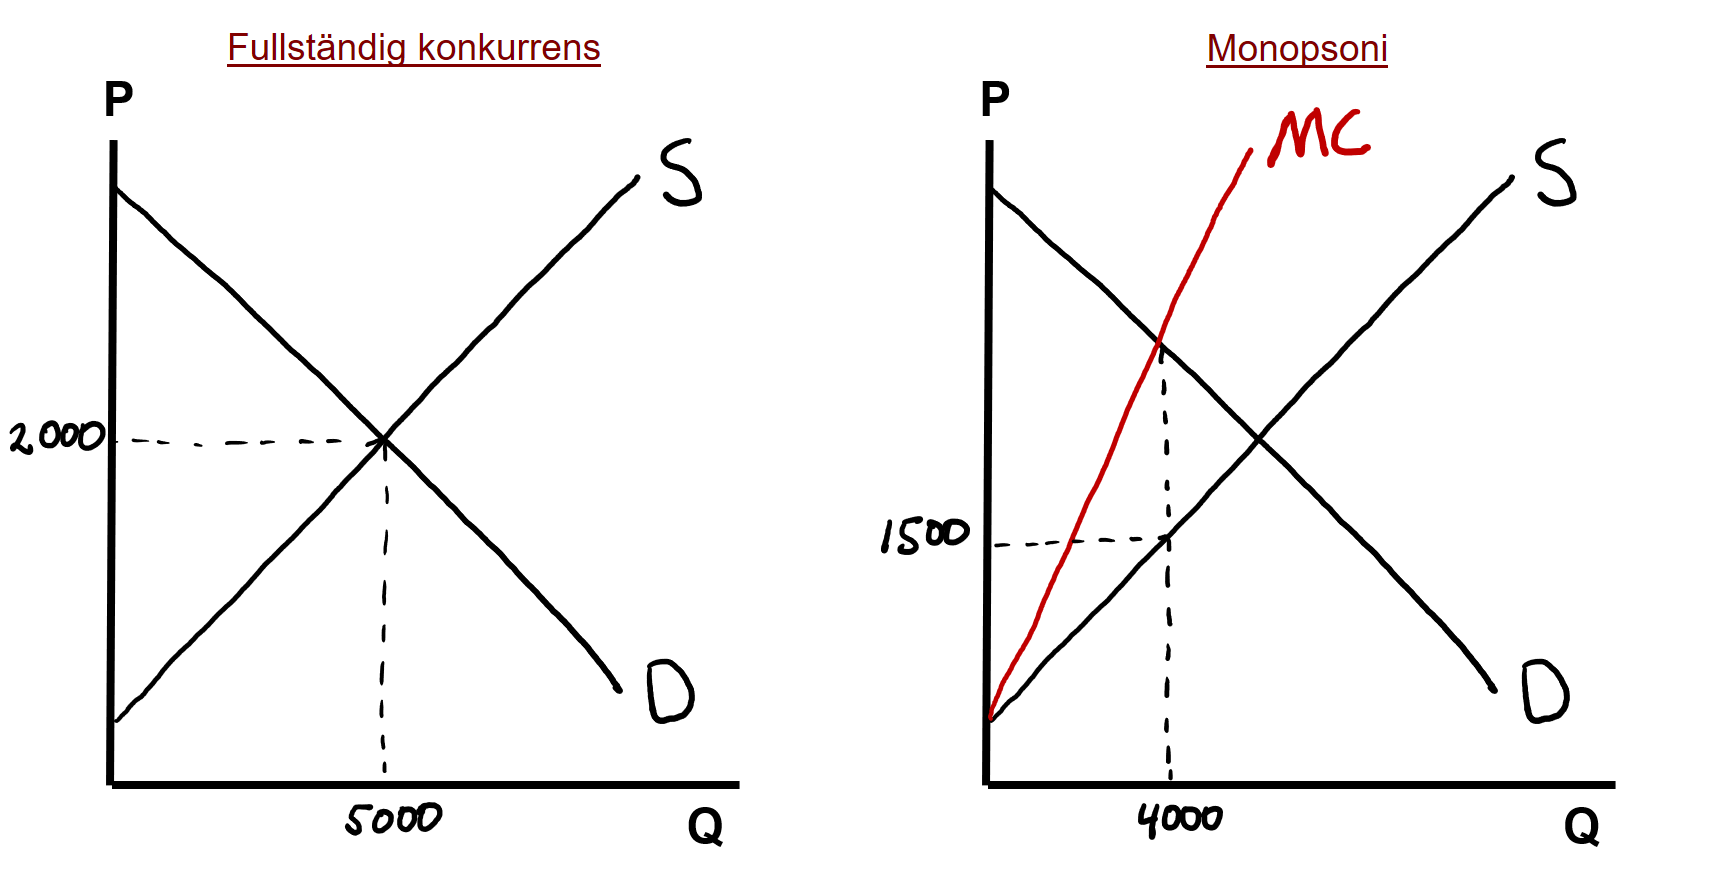
- The figure below shows the labour market under perfect competition and under monopsony. The labour‑demand curve effectively shows how much each additional worker contributes; if a firm is willing to pay €20 per hour to the last worker hired, that is roughly the value that worker brings in (marginal revenue product). Note that the labour‑supply curve under monopsony shows how many people are willing to sell their labour to this single firm (think the Blueberry King). The firm can therefore choose how many workers to “buy”: few and cheap, or many and expensive. Notice that this makes the MC curve (the cost of hiring one more worker) slope steeply upward for the monopsonist: to hire one more person you must raise the wage for all employees. So how many workers should the monopsonist hire? As many as until the last worker’s contribution equals the cost of hiring that person (MR = MC). You then use the supply curve to read off what wage you must set to attract that number of workers. The key lesson is that monopsony in the labour market leads to lower wages and fewer hires than under perfect competition.
Monopsony in the youth labour market?
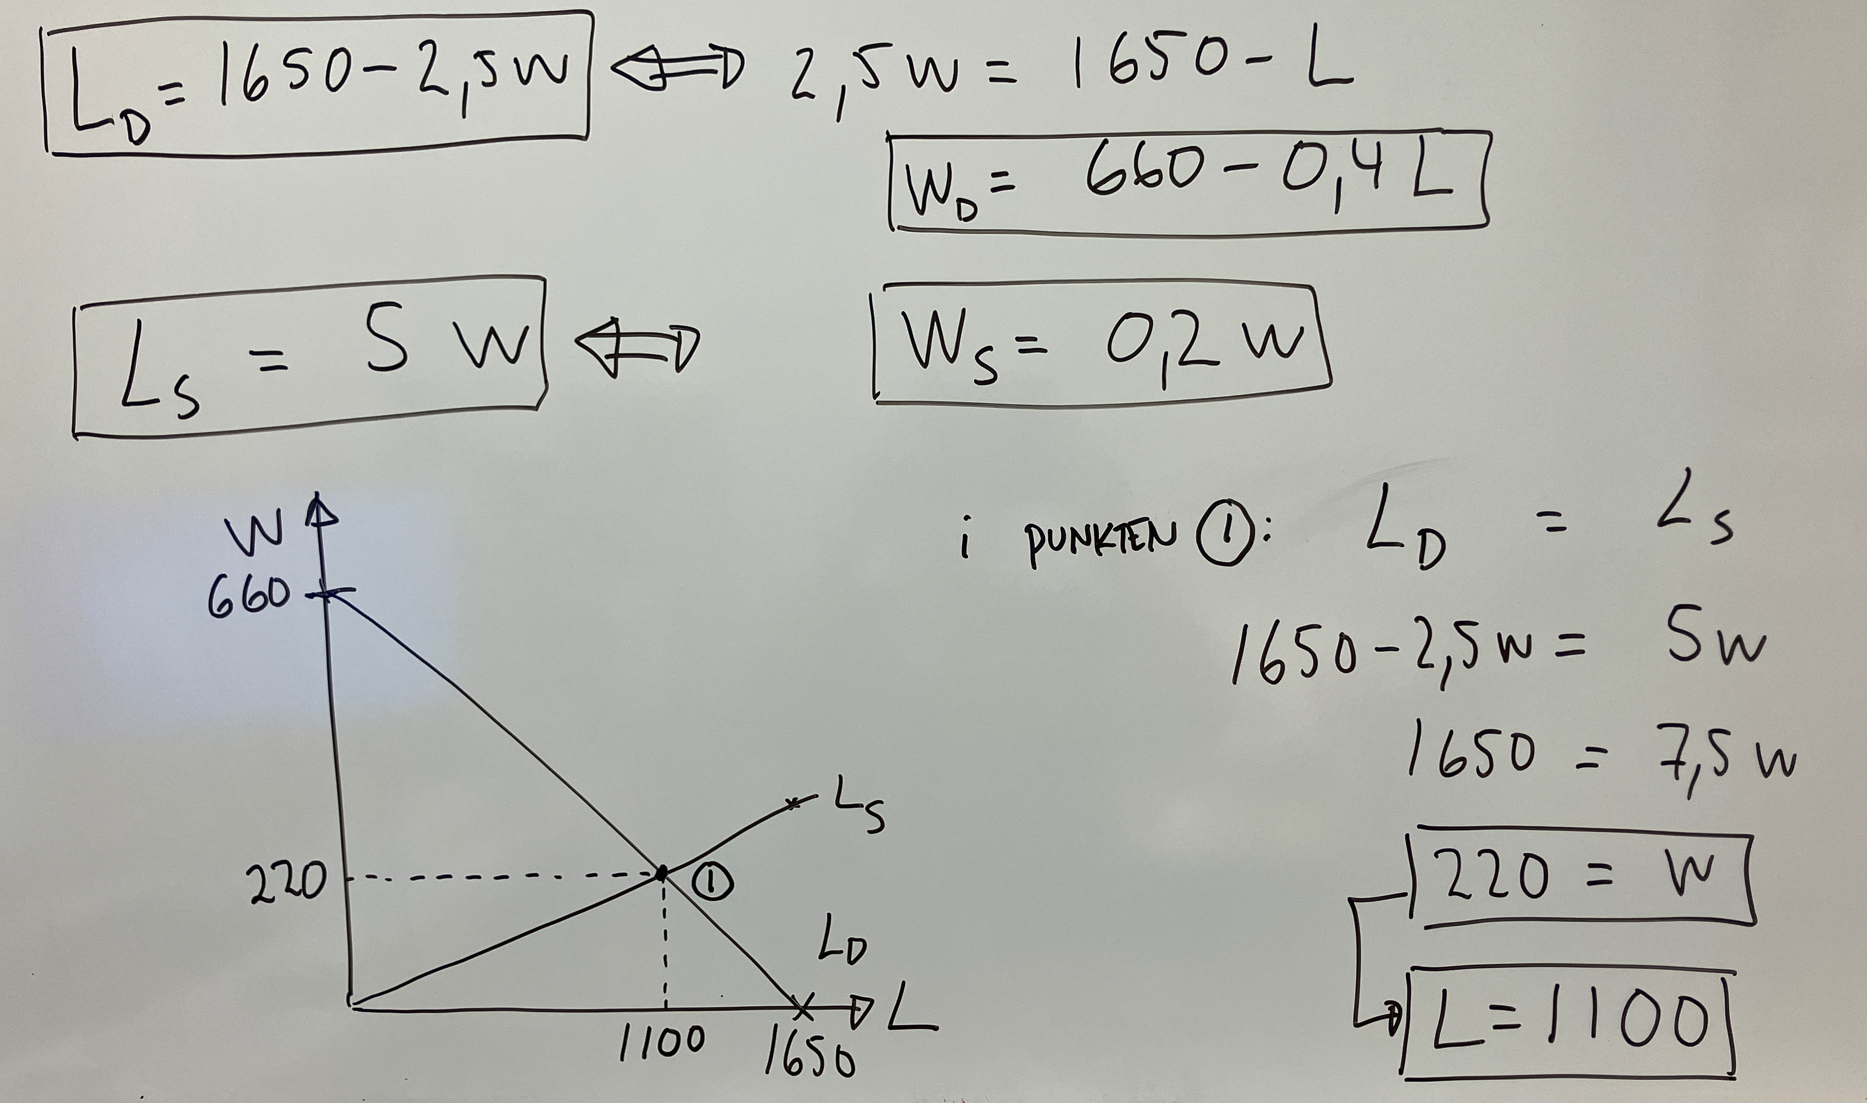
Could monopsony in the labour market help explain why young people often earn low wages? Imagine the following: in a town there are several fast‑food restaurants. Suppose this is the only industry where young people realistically have a chance of finding work. Firms’ demand for youth labour is given by \(\small L_D=1{,}650-2.5w\), where L is the number of workers (from “Labor”) and w is the wage in euros (from “wage”). The supply of youth labour is \(\small L_S=5w\).
- Draw the demand and supply curves in a diagram with the wage on the vertical axis and quantity on the horizontal axis. Based on your figure: approximately what will the wage be and how many people will get jobs, assuming the labour market is competitive?
- Given competition on the labour market, the exact wage will be and the number of young people who get jobs will be .
- The firms now merge and form a single employer. There is therefore only one firm in town hiring young people. We have thus ended up with a youth labour market characterised by monopsony. The wage on the youth labour market will then be and the number of young people who get jobs will be .
- What happens to the number of young people who get jobs if the authorities introduce a minimum wage of, say, €170?
Solve this like a standard competitive‑market problem. The only difference is that the traded good is labour and the “price” of a worker is called the wage.
-
See the figure and calculations:
-
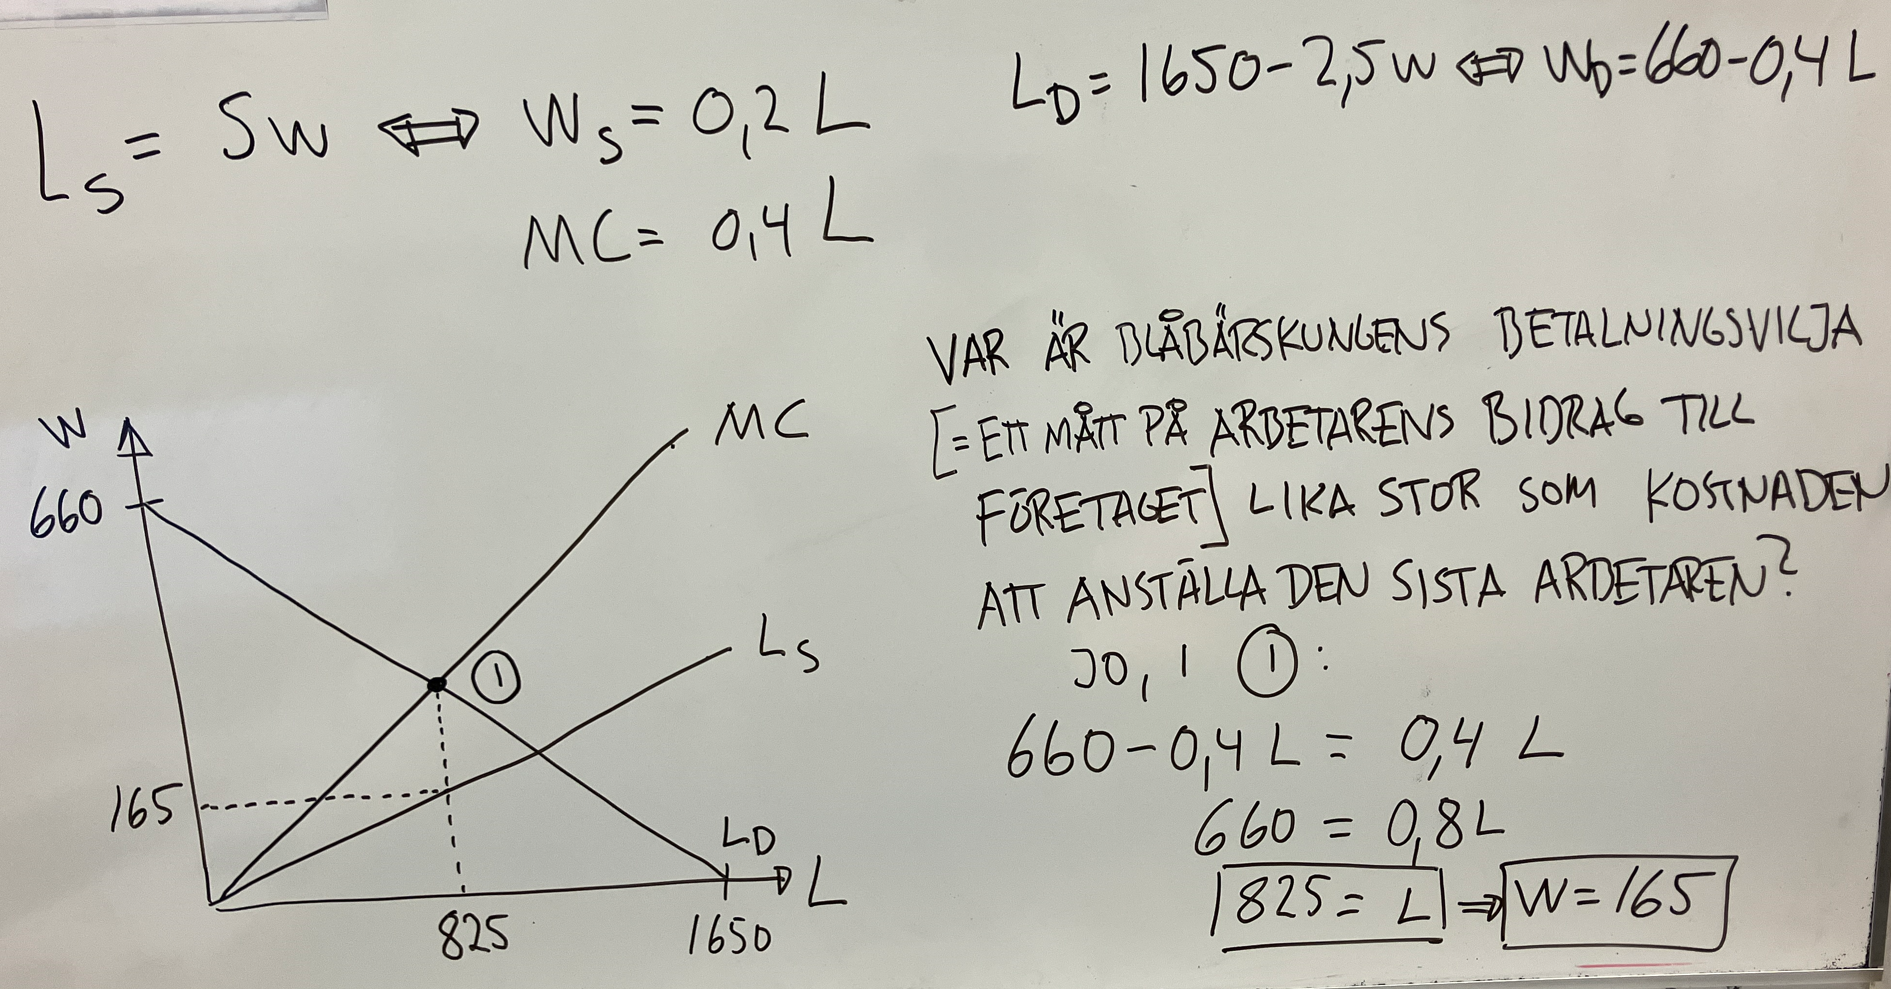
This is probably the hardest question in the course. We now have monopsony: there is only a single firm that buys labour (think “Blueberry King”). The firm can choose where on the supply curve to operate: hire few workers and pay a low wage, or hire many workers and pay a high wage. To hire an additional worker you must attract that person with a higher wage (according to the supply curve), but that also means you must raise wages for all other workers. Intuitively this implies the Blueberry King’s MC curve starts at the same point as the supply curve but then rises twice as fast as the supply curve. Mathematically you can think of the supply curve as \(\small w=0,2L\). The firm’s total wage bill is wage × number of employees, i.e. w·L, or \(\small TC=(0.2L)*L=0.2L^2\). You obtain MC by differentiating TC with respect to L: \(\small MC=2*0.2L^{2-1}=0.4L\). Profit maximisation occurs where the last worker’s contribution equals the cost of hiring that worker. You then use the supply curve to read off which wage is required to attract that many workers. See the figure and calculations:
If the authorities introduce a minimum wage of €170 the wage will (of course) rise, but note that the Blueberry King will also hire more workers. At a wage of €170, 850 people want to work (according to the supply curve). The lesson is that a minimum wage in a labour market characterised by monopsony does not necessarily lead to higher unemployment; on the contrary, a minimum wage can lead to more people getting jobs.
Can minimum wages for young people lead to more jobs?
In April 2024 the minimum wage for fast‑food workers in California was raised. In Chapter 3 we guessed that this type of price floor causes fewer jobs.
The very same kind of reform was implemented in the early 1990s when New Jersey raised its minimum wage. Card & Krueger (1993) evaluated the reform by comparing developments in New Jersey with neighbouring Pennsylvania, which did not raise its minimum wage. Here are the results:
| Before | After | Change | Difference‑in‑differences | |
|---|---|---|---|---|
| New Jersey | 20.4 | 21.0 | +0.6 | +2.7 |
| Pennsylvania | 23.3 | 21.2 | -2.1 |
In New Jersey, where the minimum wage was raised sharply, the number of employees per restaurant increased by 0.6. In the neighbouring state Pennsylvania (which did not raise the minimum wage), the number of employees decreased by 2.1. The researchers therefore concluded the minimum wage led to 2.7 more employees per restaurant.
- Why do the researchers take developments in Pennsylvania into account?
- Why does monopsony in the labour market lead to lower wages? Explain so that even someone who has not studied economics can understand.
- Draw a graph that shows how many people will get jobs, and at what wage, if the labour market is characterised by monopsony.
- The introduction of the minimum wage unexpectedly led to more jobs. Report author David Card explained that this can occur when the labour market is characterised by monopsony. Can you show a minimum wage on your graph that results in more jobs?
- Think “The road not taken.” OK, employment per restaurant in New Jersey rose when they introduced the minimum wage, but what would have happened if New Jersey had not introduced the minimum wage? Maybe the rise reflected a stronger US economy generally in that period. The development in neighbouring Pennsylvania can serve as our guess for how employment would have evolved in New Jersey absent the reform. In Pennsylvania the number of employees per restaurant fell by 2.1. We can assume the same would have happened in New Jersey without the reform. The fact that employment in New Jersey actually rose by 0.6 instead of falling by 2.1 implies the minimum‑wage introduction increased employment by 2.7 workers per restaurant. Given roughly 20 employees per restaurant, that corresponds to about a 10% increase in staff.
- See the answers in Monopsony in the youth labour market above. Practice writing your answer on paper so you’re not doing it for the first time under exam pressure.
- See the answers in Monopsony in the youth labour market above.
- See the answers in Monopsony in the youth labour market above.
- In this chapter we covered several market forms. One extreme is where competition is fierce, which yields efficiency, low prices and small profits. The other extreme is where you are the only firm in the market, which produces high prices, large profits and inefficiently low output. In reality these extremes are fairly rare. It is often more common that a few firms compete against one another. You can, for example, think of CityMarket competing with Prisma or Teboil competing with Neste and Shell. This fascinating market form — oligopolistic competition — is covered in more depth on the course “Strategic Behaviour.” You can watch how the student John Nash came up with the idea that later earned him the Nobel Prize in Economics here: