17 Money and inflation
(where you learn why everything suddenly became so expensive)
In spring 2022 the price level in Finland began to rise sharply; almost overnight most goods and services in the economy became more expensive. We had not experienced such a rapid price increase since the 1970s. In this chapter we will explore why inflation occurs. We will also discuss its opposite, deflation. Historically both inflation and deflation have had large consequences for countries around the world. Some examples are shown here:
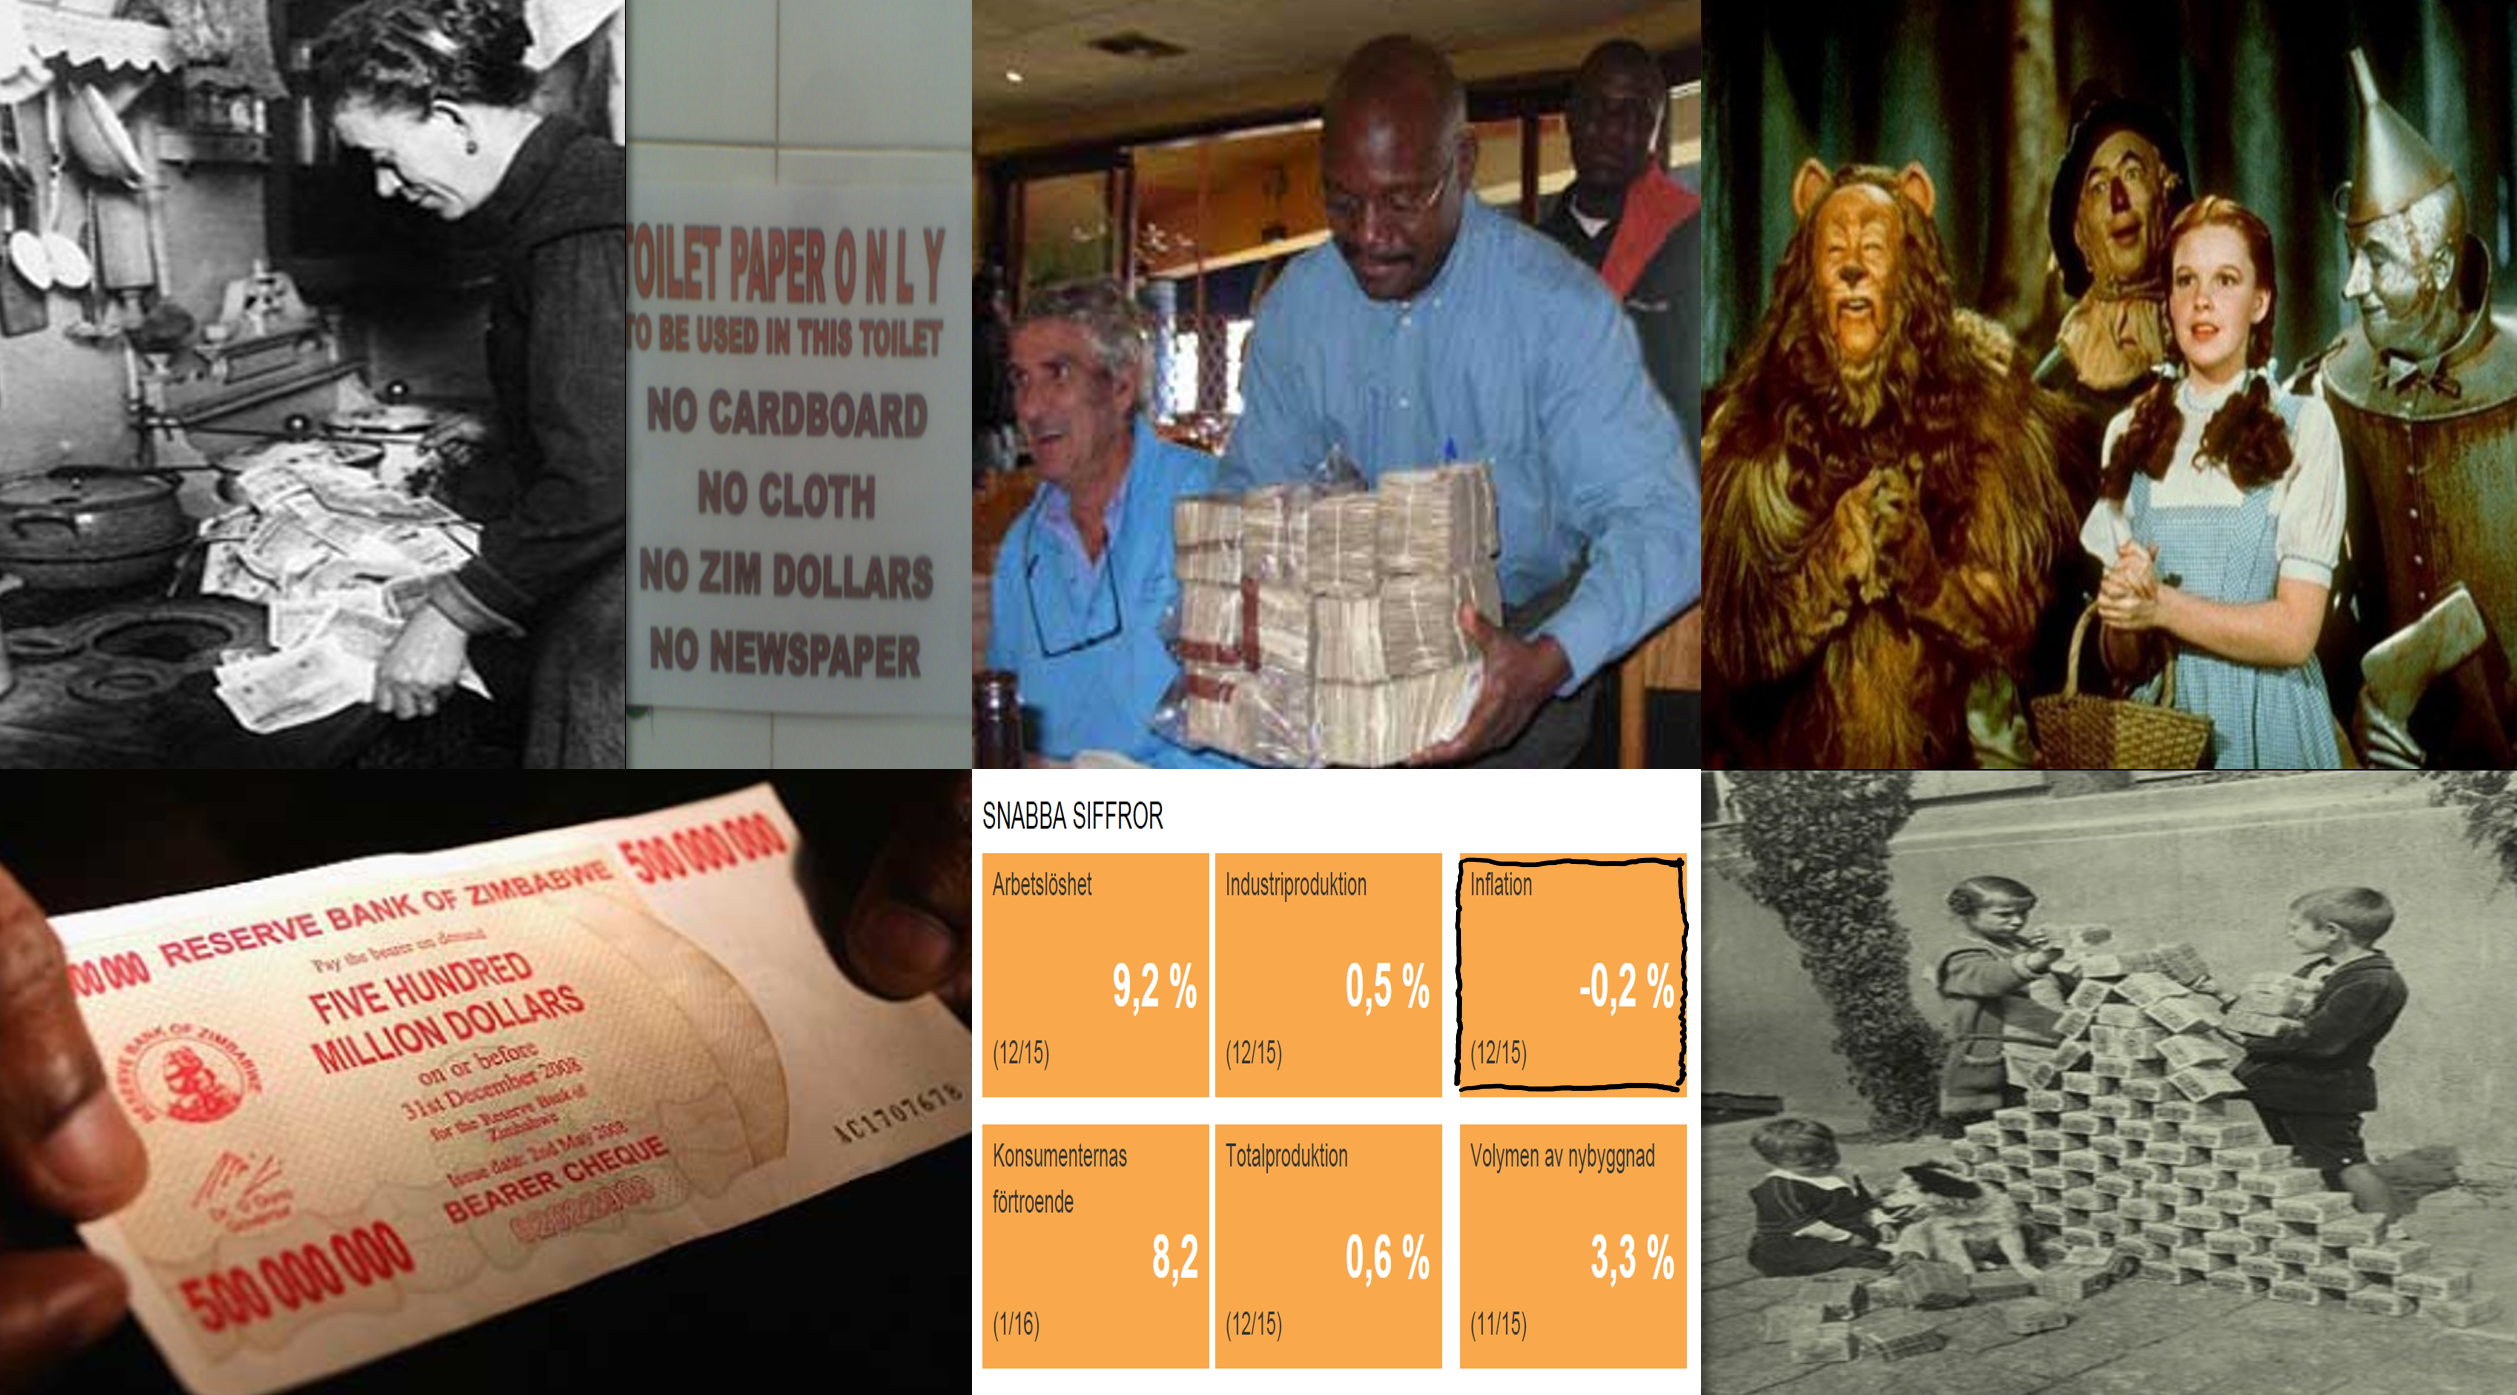
Why does the woman in the top left choose to burn the family’s life savings? How can the children in the bottom right play with bundles of banknotes worth billions? How can a Zimbabwean banknote in 2015 be denominated 500 million dollars and why do people flush notes down the toilet? And what on earth does Finland’s deflation in December 2015 have to do with The Wizard of Oz? The answer to these questions is that the value of our money matters far more than most of us realise. That is the main theme of this chapter.
17.1 The story of money
One of the most important lessons from economics is that cooperation pays. By helping each other we can all get more done, as we saw in Figure 2.2 where both Adam and Eve could go home earlier by exploiting each other’s comparative advantages.
inflation is when the general price level rises
deflation is when the general price level falls
But for this cooperation to work smoothly we need money. Imagine a society without money — a so‑called barter economy. As an economist I could only trade for a pair of shoes from the cobbler if he happened to need someone to solve an economics problem right then. Getting a pair of glasses would only be possible if the optician wanted a private economics lesson at that moment. The cobbler and the optician could only help each other if the cobbler needed glasses and the optician needed shoes. Without money cooperation is therefore severely limited; if you ever need glasses you’ll probably have to make them yourself.
The benefits of trade and cooperation are so large that people almost always find a way to invent money to facilitate them. You can see this even in prisoner‑of‑war camps during World War II.
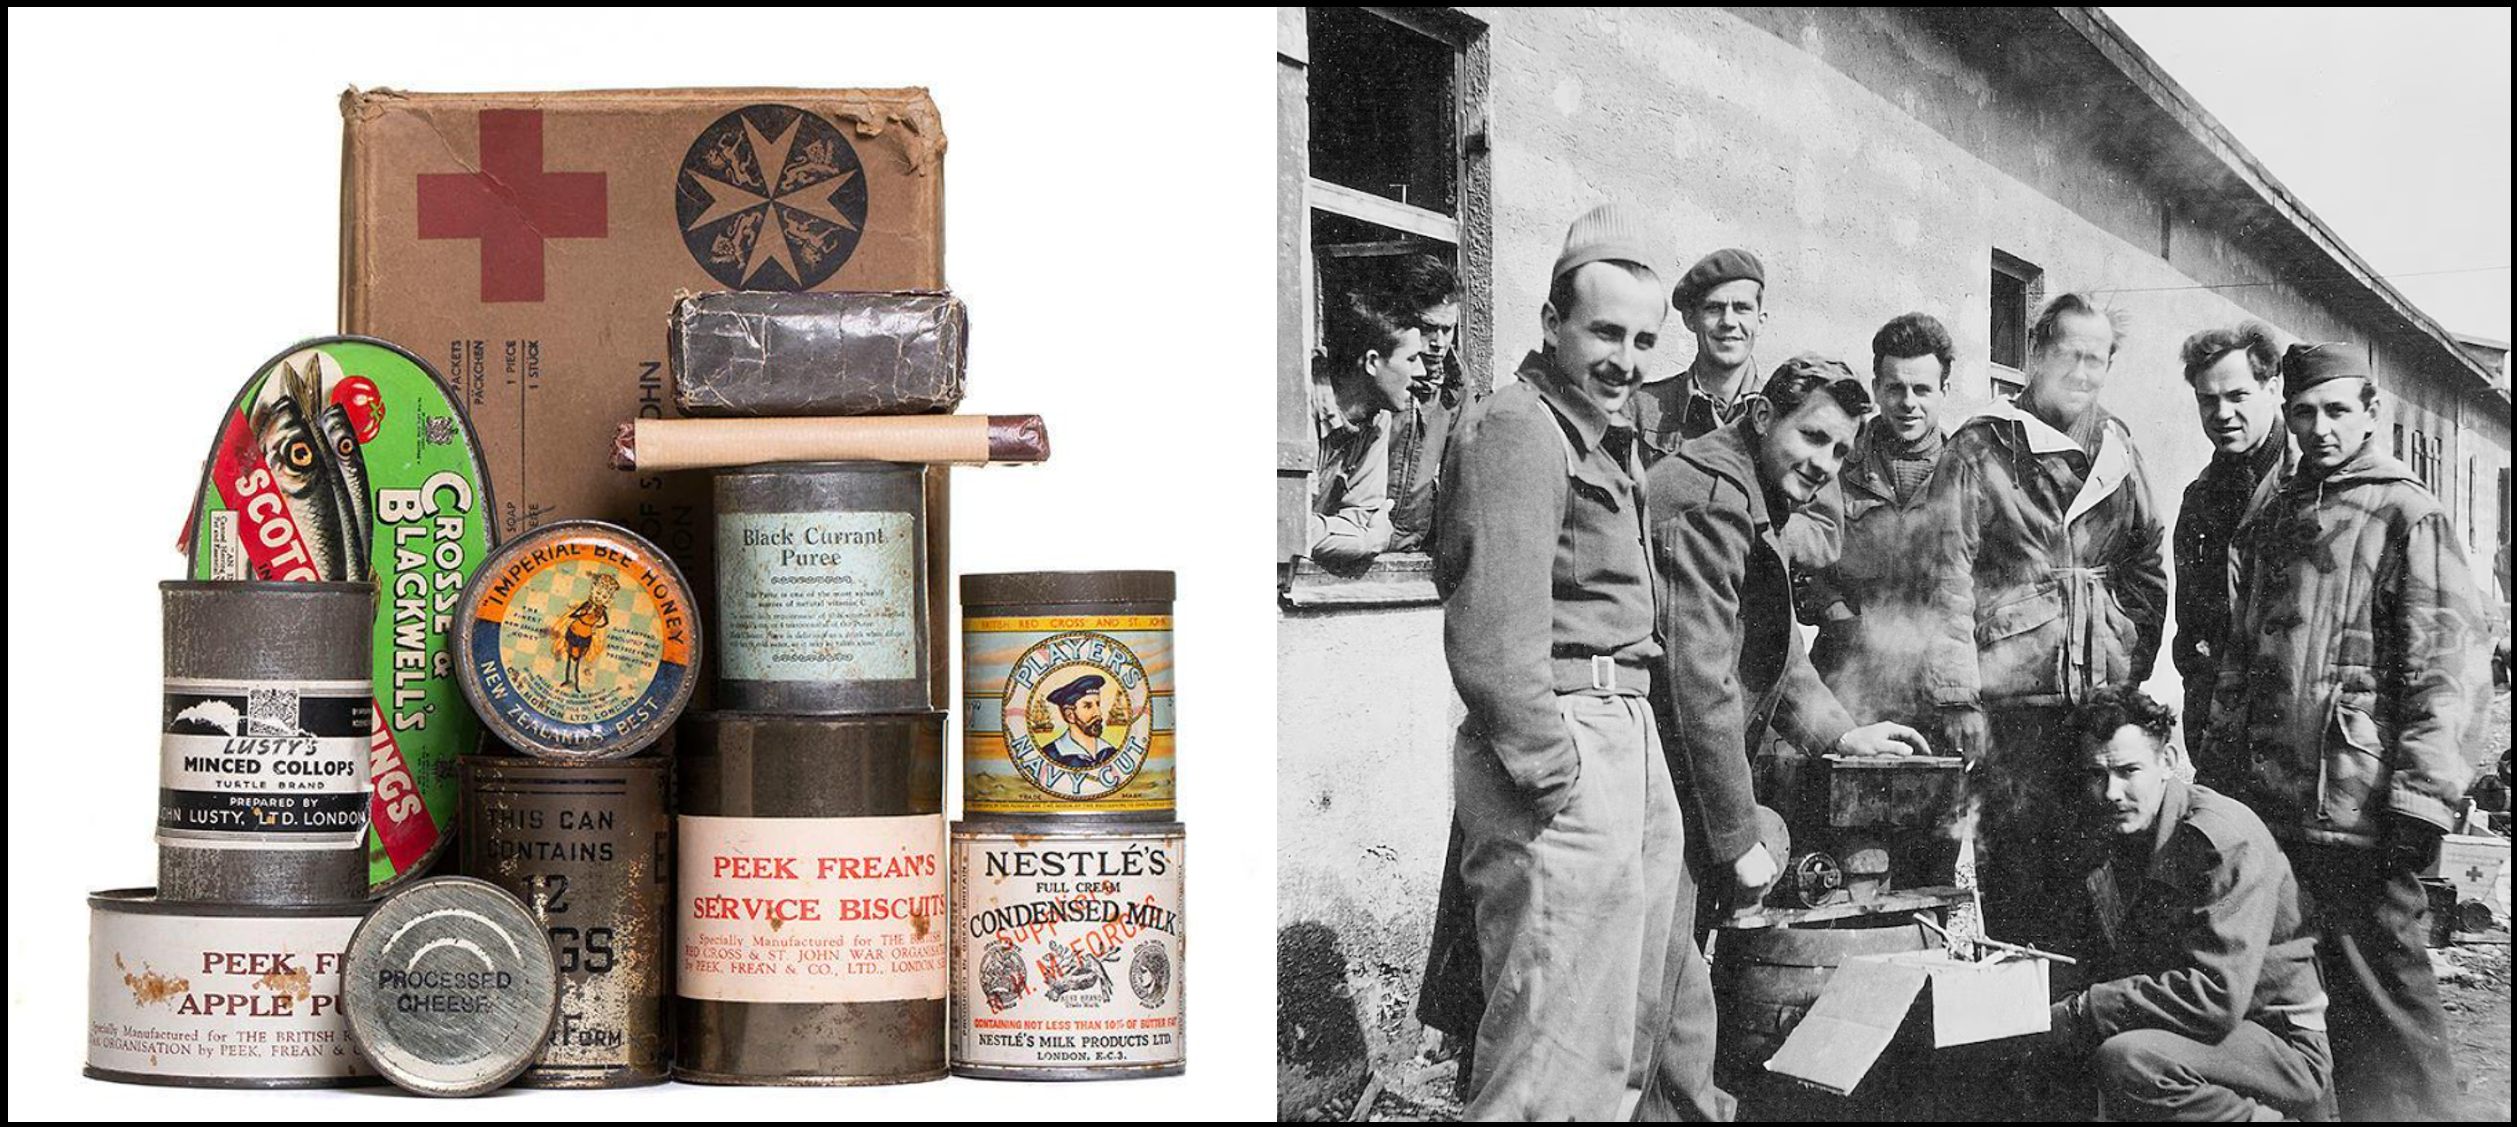
What happened when the Red Cross started distributing supplies to prisoners? Adam got chocolate and cigarettes, Bertil got a book and some plasters, Caesar got a newspaper and a pack of cards. But Adam really wanted the book. In a barter economy Adam could only get the book if Bertil fancied chocolate or a smoke — not very likely. In fact Bertil wanted Caesar’s cards. But suppose all the prisoners agree that cigarettes can be used as money. Adam then buys the book from Bertil and pays with a few cigarettes. Bertil uses the cigarettes to buy the cards from Caesar. Trade takes off.
On the island of Yap the inhabitants likewise invented money for themselves. Like the prisoners, the Yapese began using a commodity as money. By using stone wheels as money, trade on Yap took off.
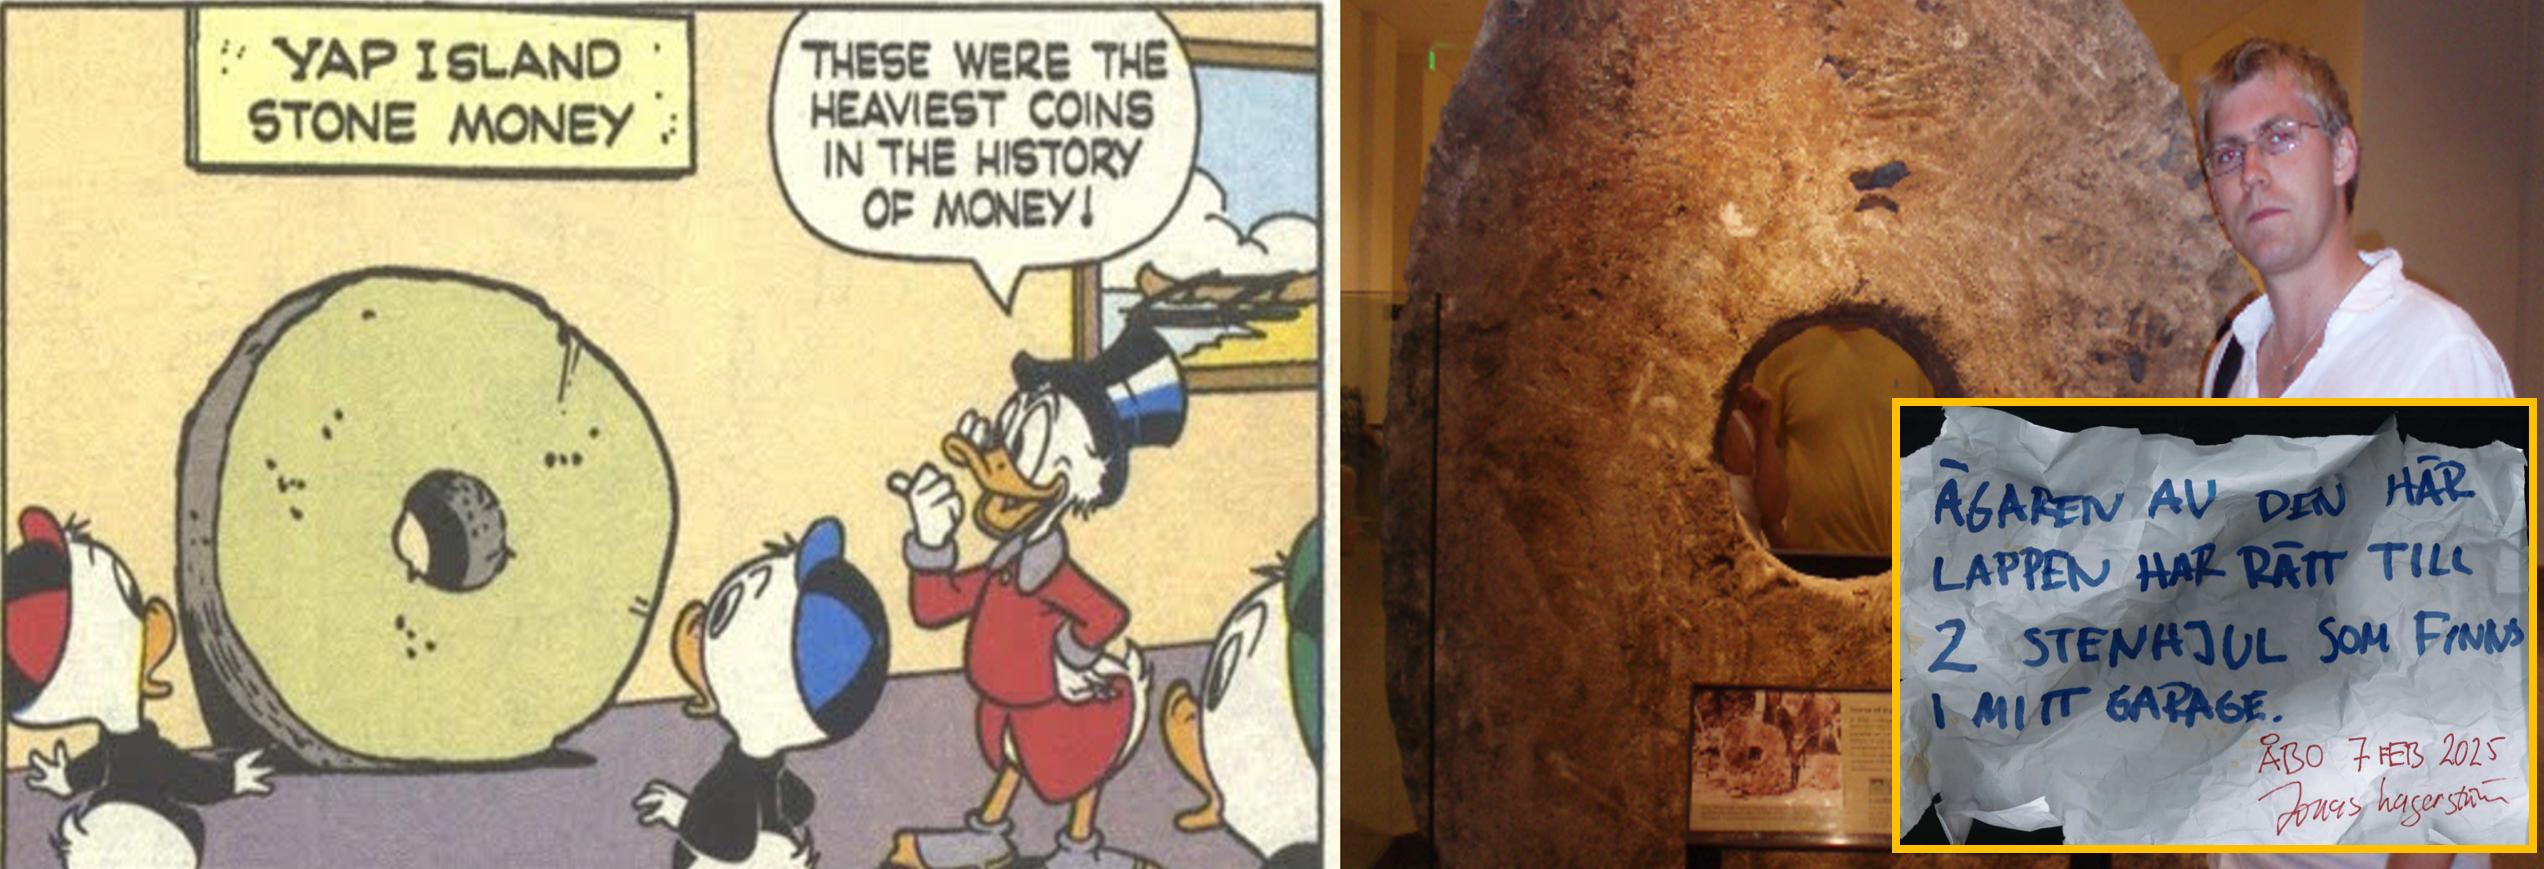
By using commodities as money — so‑called commodity money — trade took off both in the prison camp and on Yap. Yet there is an obvious drawback: if cigarettes or stone wheels are used as money you cannot at the same time use those goods for their original purpose. Also, it is extremely impractical to lug a 300‑kg stone wheel to the shop every time you want to buy milk.
The solution was as simple as it was brilliant: instead of bringing the wheels to your shop I pay you with a simple receipt. The receipt shows that you are welcome to claim the stone wheels I owe you at any time. If you want to buy from someone else you can pay them with the paper slip — and then that person becomes the owner of the stone wheels in my garage. The people of Yap had, in other words, invented banknotes. They had moved from using commodity money to using fiat money.
commodity money is money that has intrinsic value, for example cigarettes or stone wheels
fiat money is money that has no intrinsic value itself, for example a euro banknote
17.2 Measuring inflation
Inflation means the overall price level is rising. So a higher price for sushi does not necessarily mean there is inflation, and cheaper computers are not proof that Finland is experiencing deflation. It is the general price level that changes. To quickly grasp what is meant by the general price level, imagine a creature living a very uncomplicated life — for example my dog Filip.

Calculating inflation
Let’s now calculate inflation in Filip’s life over 2024–2025. Follow four steps:
Step 1. I start by listing everything Filip consumes during a year. Imagine you create a basket containing all goods and services Filip buys in the year. The table below shows that he, for example, consumes 90 cans of dog food and visits the vet twice a year.
| 2024 | 2025 | 2024 | 2025 | |
|---|---|---|---|---|
| 90 cans of dog food | €5 | €6 | €450 | €540 |
| 4 sacks of dry food | €40 | €30 | €160 | €120 |
| 2 vet visits | €150 | €170 | €300 | €340 |
| 5 toys | €12 | €12 | €60 | €60 |
| Total: | €970 | €1,060 | ||
| CPI (base year 2024) | 100 | 109.3 |
Step 2. Here I list what each good or service costs. For example, in 2024 a can of dog food cost €5 and a vet visit cost €150.
Step 3. Now add up what everything in the basket cost. In 2024 the 90 cans cost €450, the sacks of dry food €160, the vet visits €300 and the toys €60. Altogether the basket cost €970.
Step 4. Now calculate what the exact same basket costs in another year. Above you can see I computed that this basket cost €1,060 one year later. The basket has therefore risen in price. Since I did not change the basket’s contents, the price increase from €970 to €1,060 must be due to higher prices in the economy. In other words, there is inflation. How large was the inflation? As with any percentage calculation, first compute the change and then divide the change by the original level. Finally multiply by 100 to get the percentage change. Prices therefore rose by 9.3 percent. Done!
In practice it can be cumbersome to work with large sums. One way around this is to convert the basket price into a so‑called consumer price index (CPI) that takes the value 100 in a chosen base year. In the table above I converted the 2024 basket price into the index 100. I did this by taking the basket price that year (€970), dividing by €970 and multiplying the result by 100. To get a comparable index for 2025 do the same: take the basket price that year (€1,060), divide by €970 and multiply by 100. Note you can obtain inflation either by calculating the percent change in the basket price (from €970 to €1,060) or by calculating the percent change in the CPI (from 100 to 109.3). Practice a few times until you’ve got it.
consumer price index (CPI) is a price index that shows the price development of the typical goods and services households buy
Other types of price indices
Just as there are many variants of GDP and many different labour‑market measures, there are also different kinds of price indices. For example, you can construct a consumer price index for specific groups. Perhaps you want a student price index to capture students’ cost of living? Then the basket should contain everything a typical student buys in a year. Lock the basket and calculate whether it becomes more or less expensive over time.
In exactly the same way you can construct a producer price index (PPI). Here you define a typical Finnish firm and create a basket of everything it uses in a year. Maybe Fabbe’s café is a good representative for a typical firm? Then include 200 square metres of rent, 300 kg of coffee beans, five employed students and much else in the basket. If this basket becomes more expensive year after year, then there is inflation from firms’ perspective.
17.3 Inflation makes a comeback
In recent years inflation has fluctuated dramatically. Here you can see inflation in the EMU area for the period 1997 to the present.
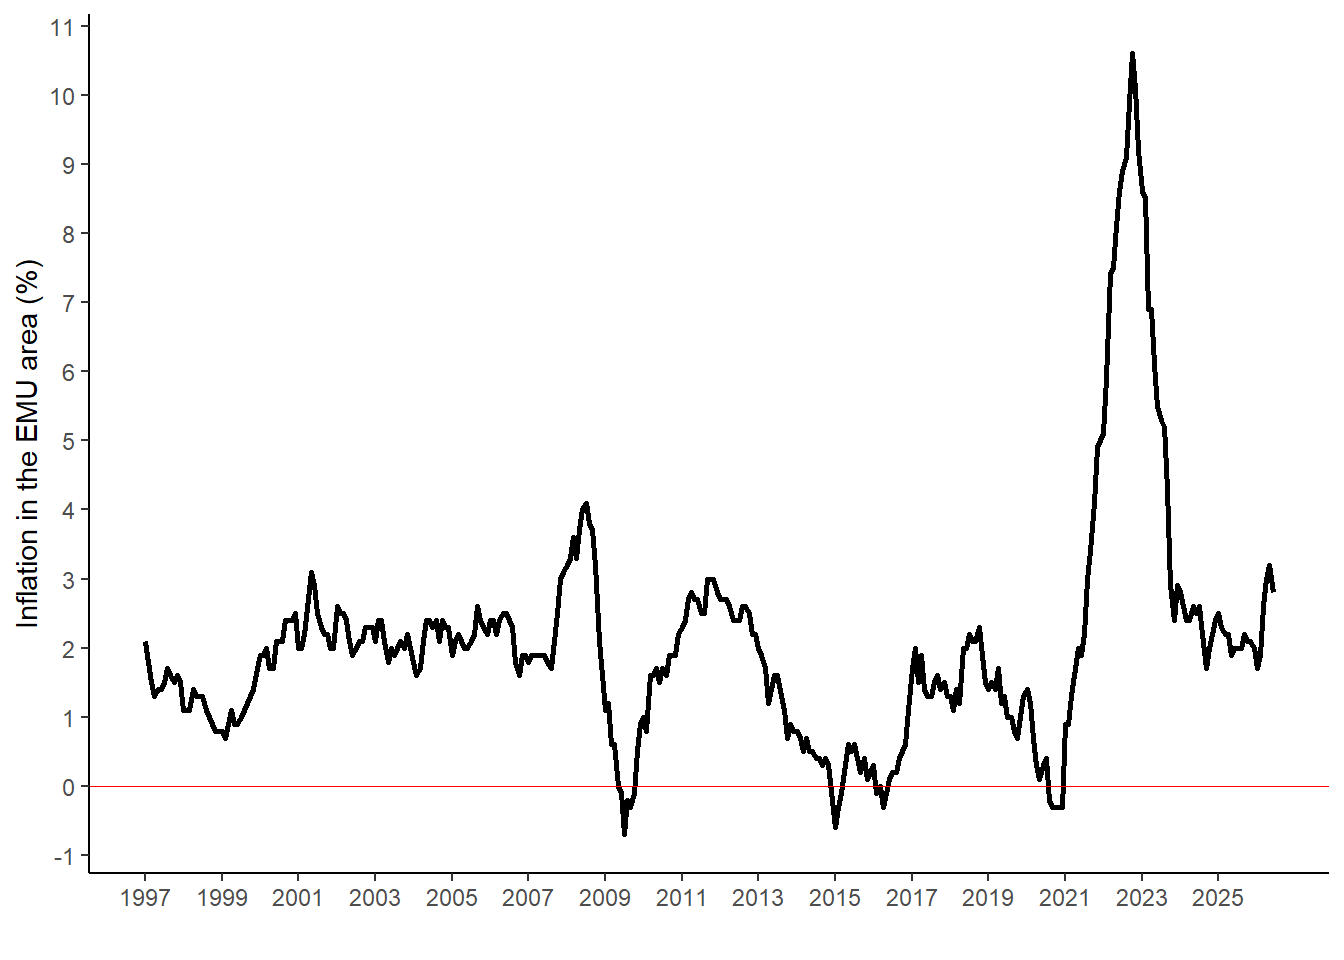
A first lesson from the chart above is that high inflation is unusual in Europe. Inflation typically runs at about 2% per year. The surge in inflation that hit hard in 2022 faded almost as quickly as it appeared. If you click the interactive map link you can see more detailed inflation data. For example, inflation varies across countries: in Finland it is currently 2.5% while in Lithuania it is 5.4%. Prices have also not risen uniformly across sectors. In Finland clothing and footwear prices have fallen by 1.6%, whereas transportation has become 6% more expensive over the past year.
What can go wrong with the inflation measure?
CPI in Finland has risen by 2.5% over the past year. You might want to use this figure to argue that study grants should be increased. At first glance the argument seems strong: if the cost of living has risen, incomes should be adjusted up by at least 2.5% — otherwise students cannot afford as much as before.
But can we trust the CPI? Think back to the dog example, where measured inflation was 9.3%. Is that really a correct measure of how much worse it became to be a dog over that period? We kept the basket fixed when calculating inflation, so the measured effect cannot be due to Filip buying more goods and services. But might something else have gone wrong?
1. Changes in quality? Perhaps the products in Filip’s life have improved over time. Last year the canned food was a nasty mush and the vet was useless. Now the canned food is so tasty you’d almost want to try a spoonful yourself and the vet has an MRI scanner that scans the whole dog. That is a clear improvement in Filip’s dog life. Life as a dog has indeed become 9.3 per cent more expensive, but that price increase does not imply life as a dog has become 9.3 per cent worse. Or maybe products have become worse? For example, the phenomenon of “shrinkflation” has received more attention lately. Shrinkflation means firms downsize packaging instead of raising prices, which causes us to underestimate how much more expensive life really has become.
2. New goods? In practice entirely new goods and services may enter Filip’s life. Our way of measuring CPI will miss these changes — because we keep the basket fixed. This effect likewise means we likely overestimate how much worse life has become for the dog.
3. Substitution possibilities? A third criticism of the CPI concerns the ability to change the composition of the basket over time. In the dog example canned food became more expensive while dry food became cheaper. Yet, under our assumption, I kept buying exactly the same basket as before. A more resourceful consumer would in practice switch to buying less canned food and more dry food. The true cost of living as a dog has therefore probably risen by less than 9.3 per cent.
As you can see, the CPI measure is not perfect. All three shortcomings likely cause us to overstate how much more expensive life has become. At first glance it may seem obvious that students should be fully compensated for inflation, but anyone aware of CPI’s measurement errors can reasonably argue that you should not be compensated for the entire CPI increase.
17.4 Why is inflation so harmful?
Now that you know something about money you can also see why money is useful — and why an eroded monetary value can be so damaging for a society. Remember the pictures of the woman burning her savings and the children playing with bundles of banknotes? Those were scenes from Germany in the early 1920s. Something happened there that sent the general price level out of control. Imagine yourself in Germany in 1922: suppose you are that woman (who a few years later may well have voted Adolf Hitler into power). Perhaps you run a small café in Berlin. How does her life change when this is a period of hyperinflation?
hyperinflation is when prices rise extremely rapidly (often defined as at least 50% inflation per month)
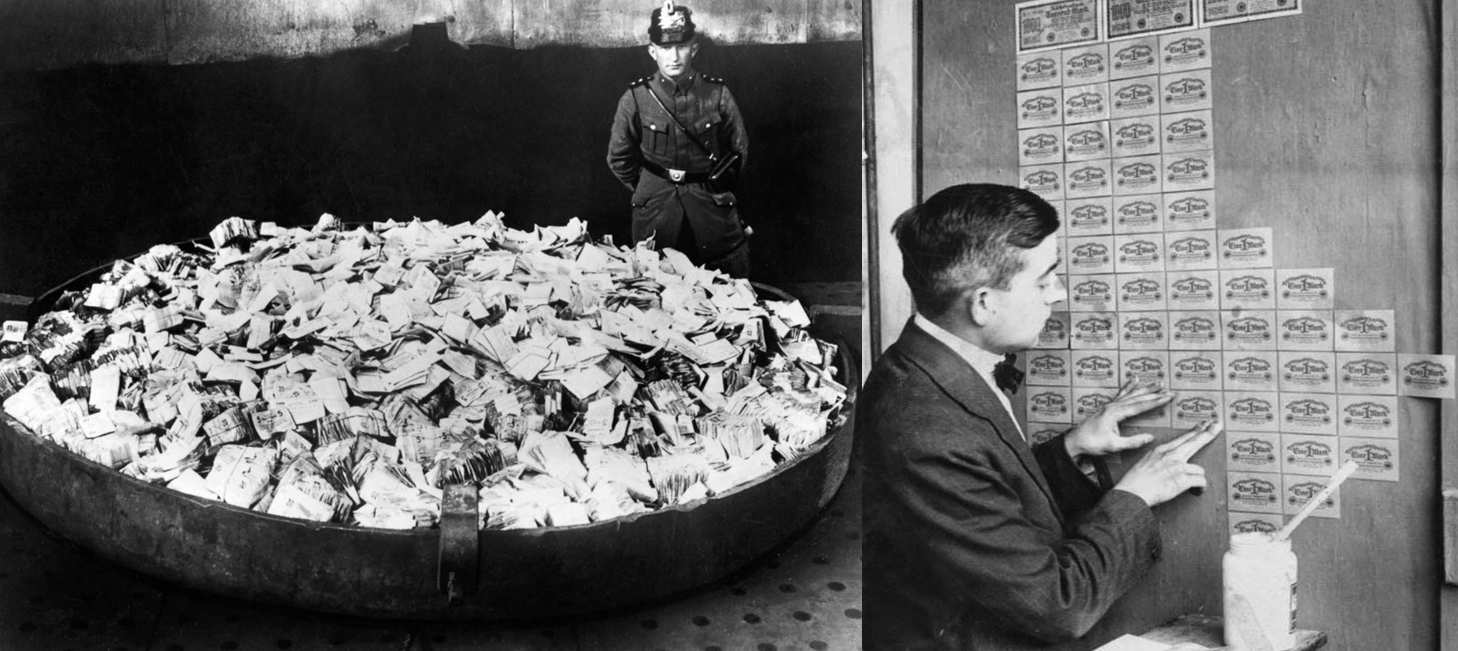
1. Menu‑costs. When all prices are rising you must also raise your prices. You continually pay more for rent and for coffee beans, and you naturally need higher receipts for what you sell. Much of your working day will therefore be spent rewriting prices on menus and price lists. There are surely more rewarding things to do with your life, right?
2. Shoe‑leather costs. Imagine a customer just bought a coffee for a million. Now the money sits in a trunk under the counter. Is it wise to leave it there? No — every minute it loses value. Right now you can buy three eggs for a million, but in a few minutes only two. The sensible thing is to spend the money as quickly as possible. It is exhausting to live in a society where everyone constantly rushes to get rid of cash. Or imagine a night out: because beer gets more expensive over the evening you might buy all 14 beers up front — and then have to drink warm, flat beer late at night. This is an example of shoe‑leather costs — a metaphor for worn shoe soles from constantly running to avoid holding money.

3. Randomly redistributes wealth. Late at night you stagger home to your flat in Berlin. Time to light a cosy fire! You stuff the stove with banknotes. Last year you put the family’s entire savings—100,000 marks—into the bank. Since you did not expect inflation you accepted a 2 per cent interest rate. Then hyperinflation struck and a coffee now costs a million. The unexpected inflation effectively wiped out your savings. The notes are now only good for burning or as toys for the children.
You won’t feel much better when you think of your neighbour Wolfgang Flür. On the very day you deposited the family fortune, Wolfgang took out a bank loan of 100,000 marks. Because nobody expected high inflation he borrowed at 5 per cent. Deep in debt, he invested the loan in a giant factory. A year later a coffee cost a million and Wolfgang had no trouble repaying his loan. He is now debt‑free and one of Germany’s leading industrialists. As you can see, hyperinflation randomly rearranged people’s fortunes.
4. Prices cease to function as signals. A major virtue of prices is that they convey important information. The price system guides us to make sensible decisions. If gym membership prices rise, that signals people value gyms; if CD prices fall, that signals waning demand. As an entrepreneur you can use those price signals to decide where to invest. In that situation it might be better business to open a gym than a CD shop. But in Germany in 1921 it was almost impossible to use prices as reliable signals of what was rising or falling — and that greatly increases the risk of investing in the wrong industry.
17.5 Grade inflation in schools
It is often easier to understand a phenomenon by relating it to your own everyday life. Let us therefore look inside an institution that also suffers from a kind of inflation. In recent decades school grades have risen sharply in most countries.
In an ideal world grades — like prices — help us make smart decisions. An employer wanting to hire can use grades to screen the most suitable candidate. You can look at your grades and see which subjects you excel in and which need more work. Åbo Akademi can use grades when awarding scholarships and when deciding who is best prepared to succeed at a top foreign university.
But in reality grades do not work as well as theory suggests. Take a look at this chart, which reveals dramatic differences in grades across basic courses at Åbo Akademi.
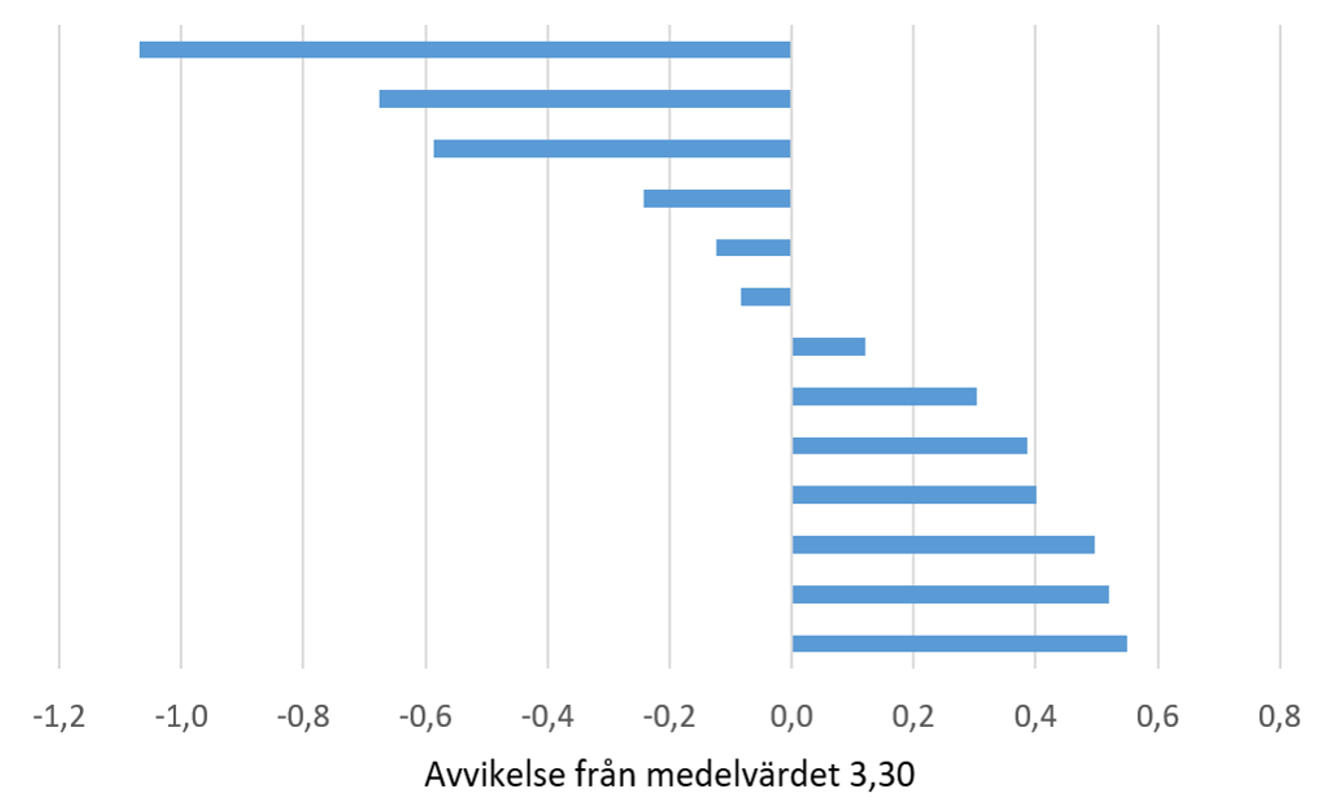
To create this chart I collected all students’ grades in 13 compulsory introductory courses at Åbo Akademi over the past five years. On average the courses award a grade of 3.3, but the chart reveals huge differences between courses. In some courses the average student grade is just above 2 out of 5, while other courses give a grade of 4 to almost everyone. In other words, it’s easy to get a high grade in some courses but much harder in others.
To see why this matters, imagine you and Ronja apply for the same job. You graduated from a subject where high grades are hard to get, while Ronja comes from a subject where almost everyone gets high marks. The employer rips their hair out. Who should they hire? Ronja’s grades are much higher, but how do we know that’s because Ronja is better rather than because her subject always gives high grades?
The problem becomes even worse when grades are awarded like this:
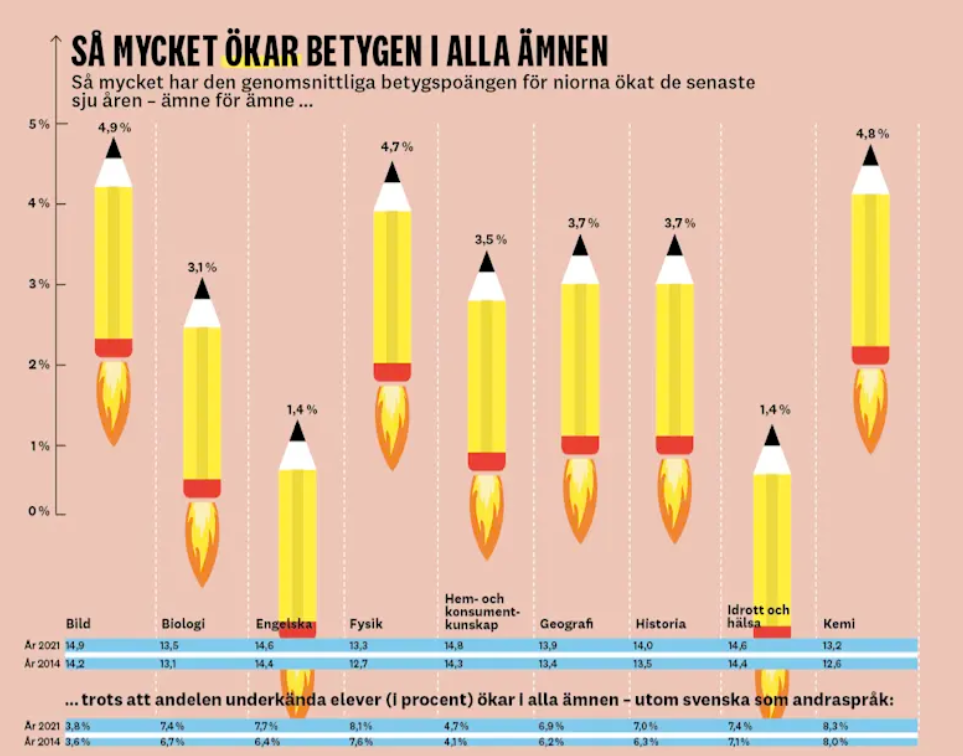
Here you see how grades have risen in Year 9 in Swedish schools. In Art, for example, grades have increased by almost 5 percent in recent years. These rising grades are not because pupils suddenly became better but because teachers have become more generous with marks. Now you apply for a job. This time you compete with Bengt‑Åke who graduated twenty years ago. Again it is hard for the employer to judge who is best suited. You may have much higher grades than Bengt‑Åke, but how can we tell whether that’s because you are better or because you graduated in a period when it was much easier to get high grades?
The lesson from both charts is that grade inflation makes it difficult to use grades for decision‑making. Pupils risk choosing the wrong profession. Universities may admit the wrong students. Firms tend to hire the wrong people.
The same problem arises when inflation makes prices unreliable signals. Imagine you started a restaurant in autumn 2022. You might have interpreted the then 16 percent rise in food and drink prices as a genuine increase in Finns’ appetite for eating out. When demand for something rises its price typically rises too, right? So you invest €1 million in a new restaurant in Åbo — only to discover that the price increases were driven by inflation, not by higher demand for restaurants. Inflation therefore raises the risk of misinvestment, which can be a tragedy for you as an entrepreneur and a large waste for society as a whole.
17.6 Why is deflation so harmful?
Inflation in 2022 was a major threat to the global economy, but a more common worry during your lifetime has been inflation that is too low. The risk of deflation — the general price level falling — has been worryingly large. As you can see in Figure 17.1 the EMU area experienced deflation in 2009, 2015, 2016 and 2020. Falling prices might sound pleasant, but think: what would you do today if you knew everything would be cheaper tomorrow? Why buy a gym membership or treat yourself to an expensive restaurant meal today when everything will be much cheaper tomorrow? With high inflation the incentive was to consume as quickly as possible. With deflation the opposite holds: you postpone consumption. The danger is therefore that aggregate demand collapses. And as you learned in Chapter 14 falling AD in the short run leads to lower GDP and higher unemployment.
Deflation also randomly redistributes wealth. If unexpected inflation was a disaster for savers, then unexpected deflation is a bonanza for savers. And because unexpected inflation was great for Wolfgang Flür and others who had borrowed in Germany in 1921, unexpected deflation is correspondingly disastrous for borrowers.
17.7 So why does inflation occur?
So far we have covered how to measure inflation. We have also learned what money is — and what problems arise when you can no longer trust it to hold its value. But why does inflation occur? To make it concrete, imagine you are sent to Venezuela to help sort out the economy. Already at Caracas airport you notice the country is suffering from sky‑high inflation: a cup of coffee cost 1 bolívar yesterday, today it costs 100 bolívares, and everyone at the airport is convinced it will cost 10,000 bolívares tomorrow. You immediately realise it must be hard to live in Caracas. Economic theory suggests three explanations for why prices can rise so fast:
1. Less competition in markets? One possible explanation is that competition between firms has weakened. If you’re the only supplier in your industry you can set higher prices — customers have no alternative. But can Venezuela’s runaway price level really be explained by reduced competition? Inflation there runs at millions of percent per year and has done so for many years. Moreover, competition has typically increased thanks to globalisation, free trade and the internet, which should put downward pressure on prices. So this cannot be the main explanation.
2. Higher costs for firms? An alternative explanation is on the supply side. Maybe coffee at the Caracas airport is so expensive because it has become costlier for the café owner to operate. Bottlenecks in production are one such reason. During the pandemic global logistics and transport networks broke down: lockdowns, congested ports and shortages of trucks and containers made shipping coffee beans complicated and costly, forcing firms to raise prices. Russia’s attack on Ukraine also made business harder by pushing up energy costs. Some economists even propose “heatflation” — the idea that climate change will raise prices over time. But can these factors explain Venezuela’s inflation? That country has experienced hyperinflation for more than a decade; it can hardly be due to the pandemic or climate change alone.
3. Increased demand in the economy? That leaves one plausible explanation for a continually rising general price level: rising aggregate demand. What underlying factor could drive stronger demand? Economists have suggested several recent hypotheses. Maybe it’s so‑called “funflation” — people splurging on travel and entertainment after the pandemic, pushing up prices. Or “tourflation”: more people attending concerts. Nearly every weekend last summer there were big shows in Stockholm — Springsteen, Elton John, Harry Styles, Ed Sheeran, Coldplay, Håkan Hellström. It is not only ticket prices that rose: travel, beer and hot dogs, and hotel rates rose too. Some argue such phenomena contributed to the unexpectedly high inflation in Sweden last summer, though most economists think individual concerts are too small to drive national inflation. There must be a better explanation — and the answer is that demand‑driven inflation is usually caused by an increase in the money supply. Below is a column I wrote the day after Russia invaded Ukraine, summarising why inflation surged in 2022.
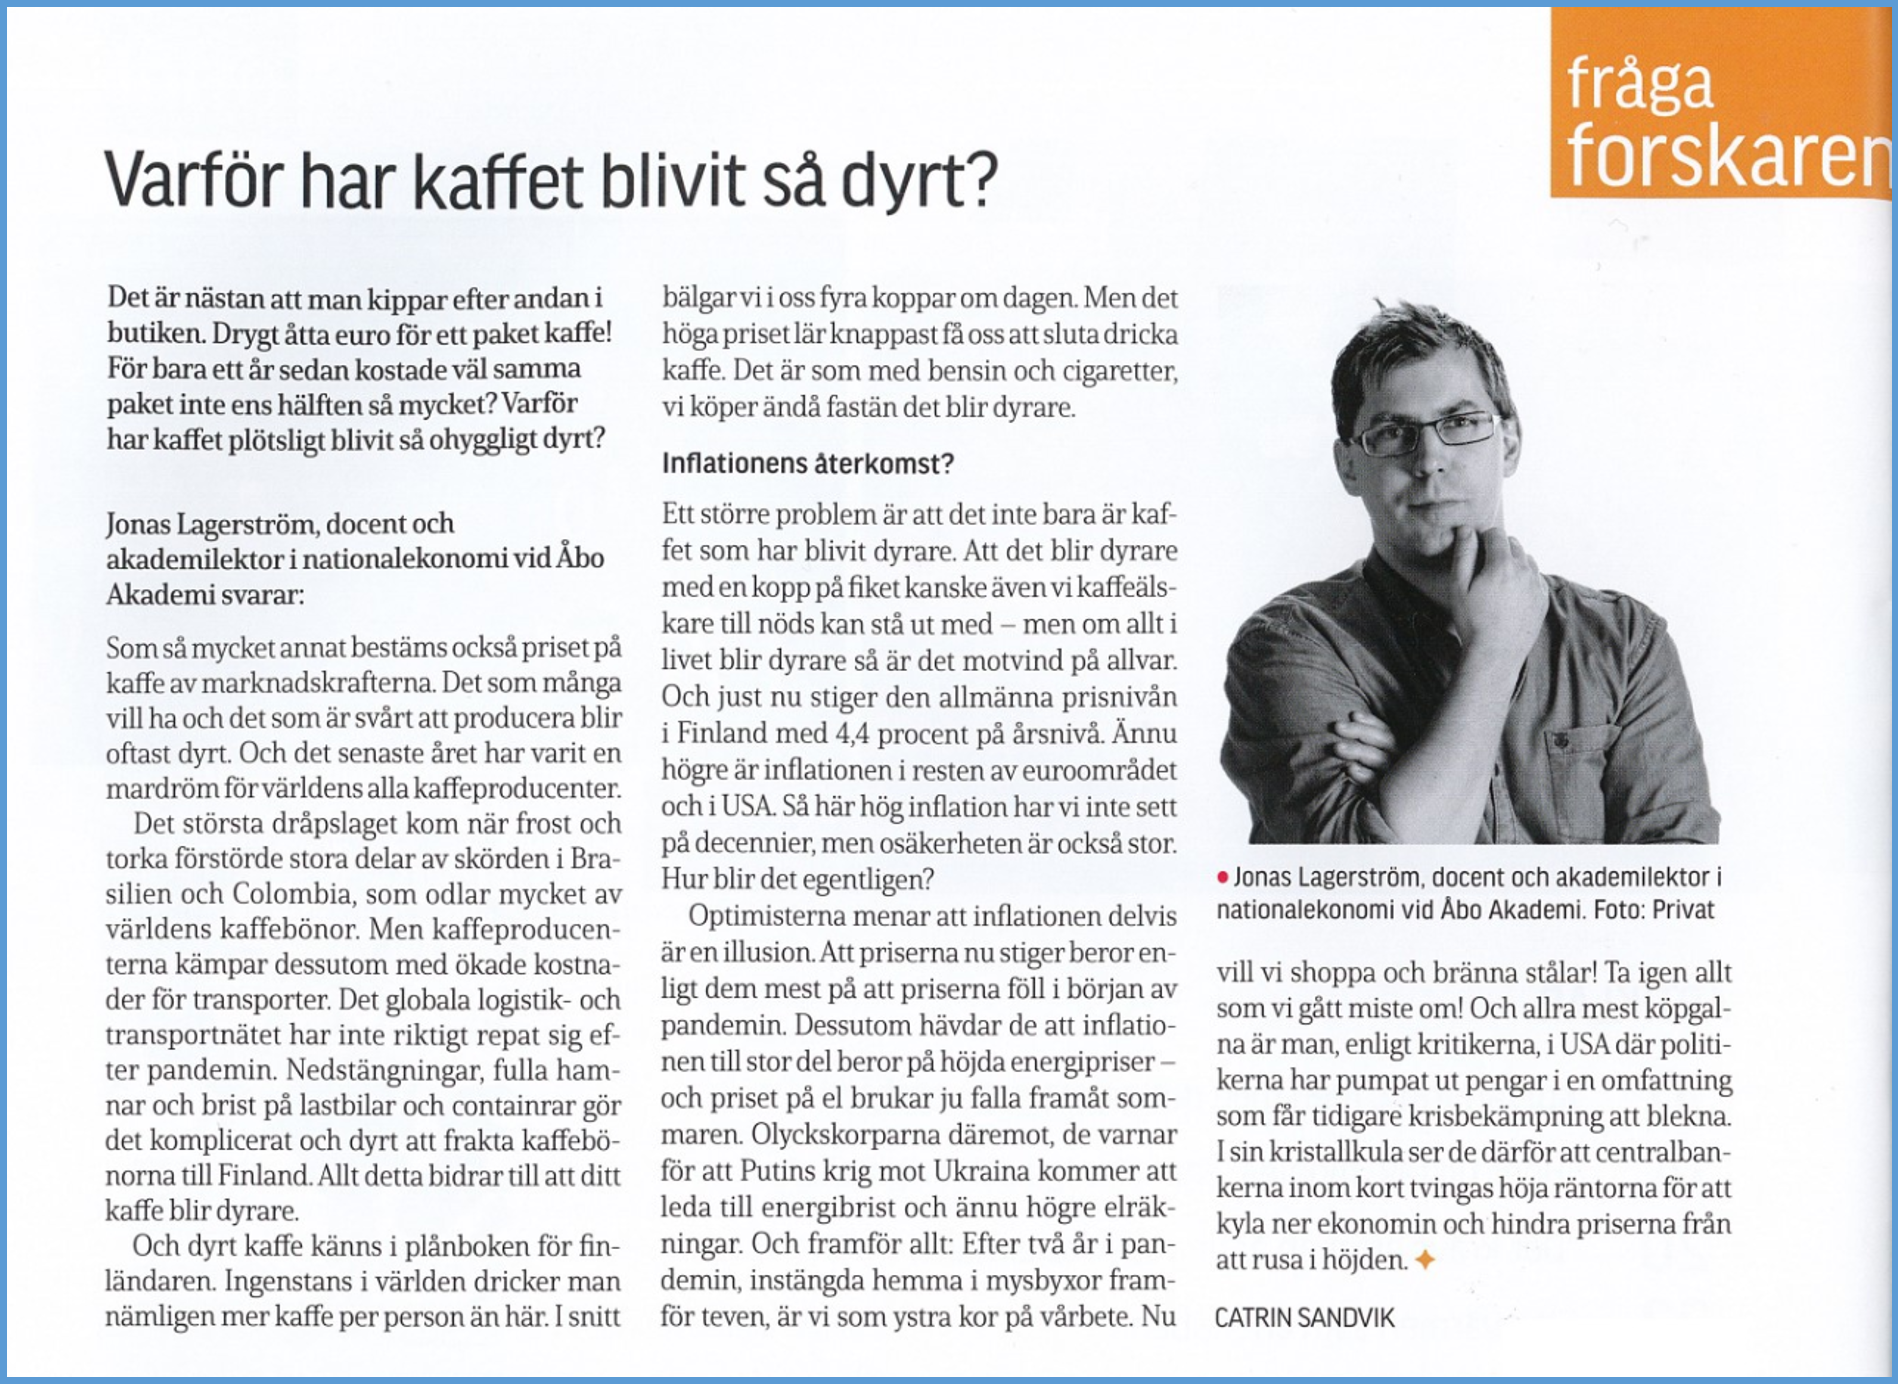
Inflation can arise for several reasons, but very high inflation that persists for many years is most likely caused by authorities increasing the money supply. We see this theoretically in the AD‑AS model. Imagine, for example, the authorities print €10,000 for every Finn and hand it out as a gift. With higher disposable incomes Finns’ demand for goods and services rises, which in the short run can lead to higher output. In the long run, however, prices and wages will be renegotiated upward, and we return to potential GDP but with higher nominal wages and a higher price level. But does this theory match reality? Let’s investigate!
cost‑push inflation is when inflation is driven by higher production costs, such as wages and raw materials
demand‑pull inflation are price increases that arise from stronger demand (for example because the money supply has increased)
Experiment: Auction during the lecture
During the lecture on 11 February 2025 I auctioned three items: a Nocco, an After Eight and a bag of nuts. Three students were each given a small amount of money to bid. The picture below shows what the products sold for:
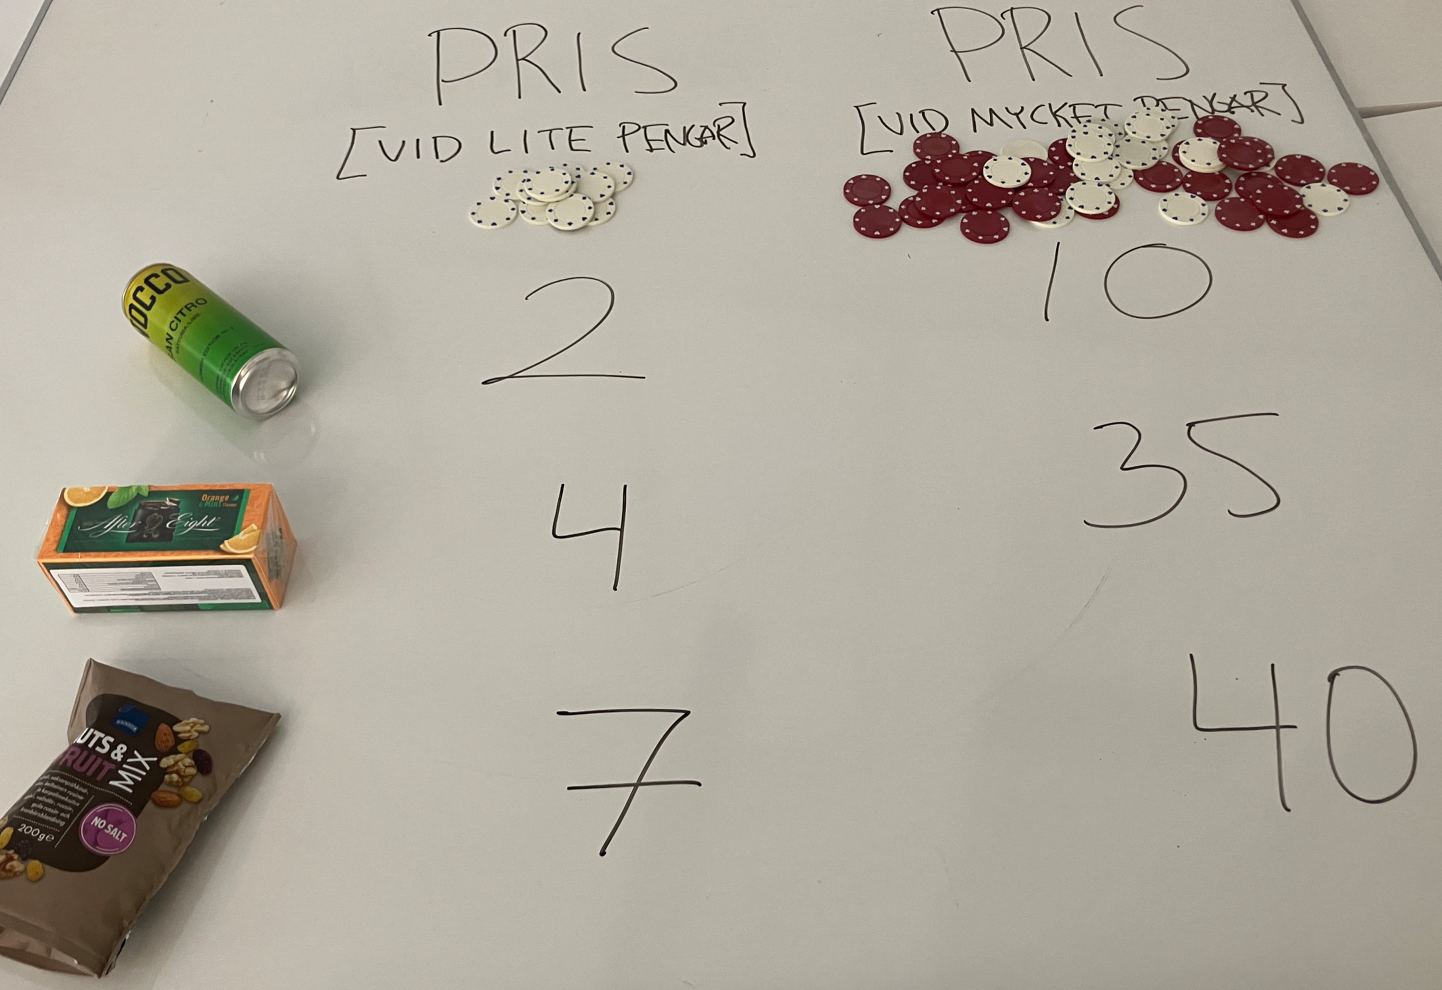
In one column you see the prices when I gave each student a small amount of money. The drink sold for 2 tokens, the chocolate for 4 and the nuts for 7. We then repeated the exact same auction but this time the students received about five times more money. As you can see, this caused prices to rise sharply. It seems the money supply can predict the price level—at least in a lecture hall at Åbo Akademi in 2025.
Natural experiment 1: The prison camp
In many prisoner‑of‑war camps during World War II cigarettes became money, which made trade among prisoners easier. What do you think happens if the Red Cross suddenly increases the number of cigarettes in the camp tenfold?
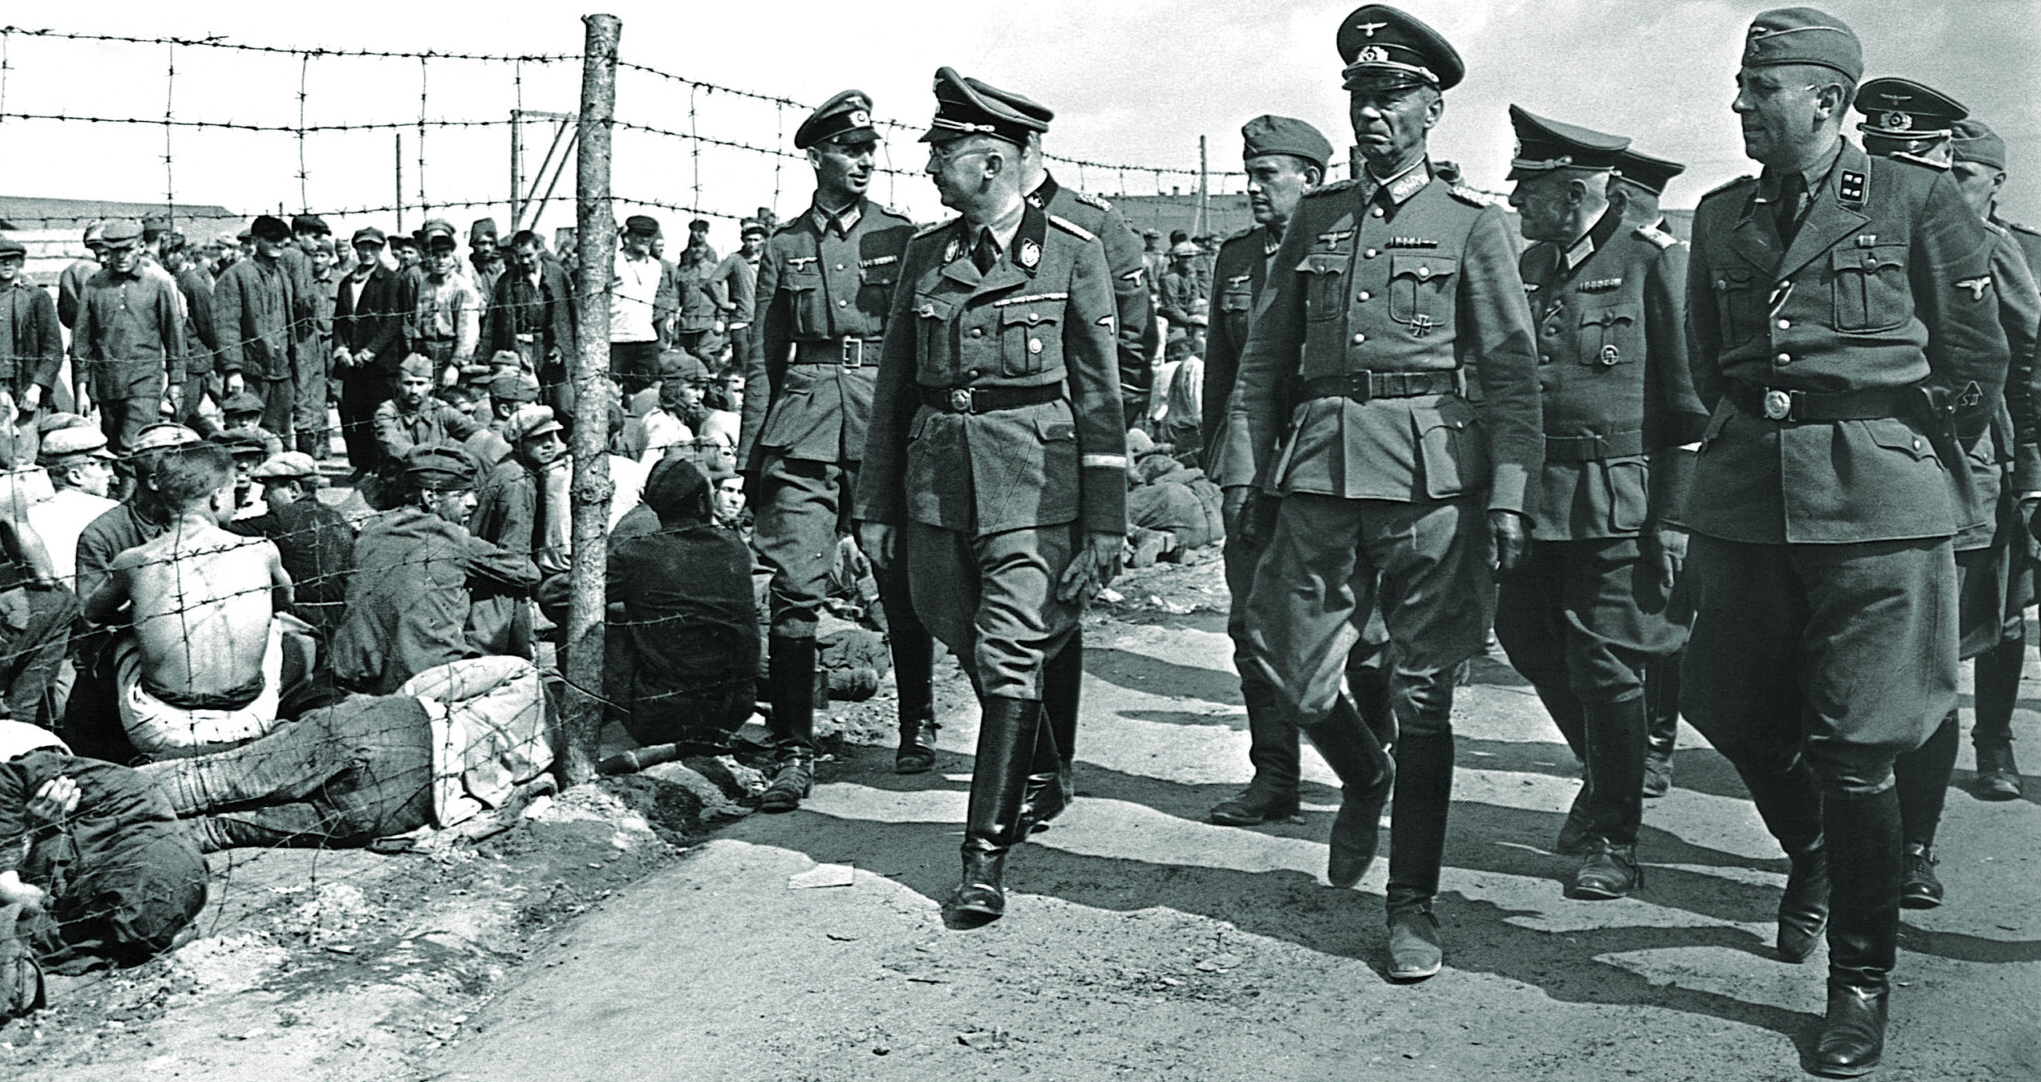
One guess is that all prisoners will feel richer — and therefore want to buy more. In the short run sales increase, but in the long run prices rise instead. It is likely that after a while all prices will be ten times higher than before. That is exactly what happened. More money led ultimately only to higher prices in the camp.
Natural experiment 2: Finland removes two zeros
The year is 1963 and your grandmother is thinking of buying a house in Turku. A typical house costs 100,000 marks and your grandmother earns 50,000 marks a year. What do you think would happen if the authorities suddenly reduced the money supply dramatically — for example by burning 99 per cent of all cash? That is exactly what happened in Finland in 1963: in a currency reform two zeros were removed from all banknotes. The result was that all wages and all prices became one hundredth of their previous levels. Your grandmother’s annual salary became 500 marks and houses cost 1,000 marks. The money supply had an extremely clear effect on Finland’s price level.
Natural experiment 3: Germany and Poland print money in the 1920s
The figure below shows developments in Germany and Poland during the dramatic early 1920s.
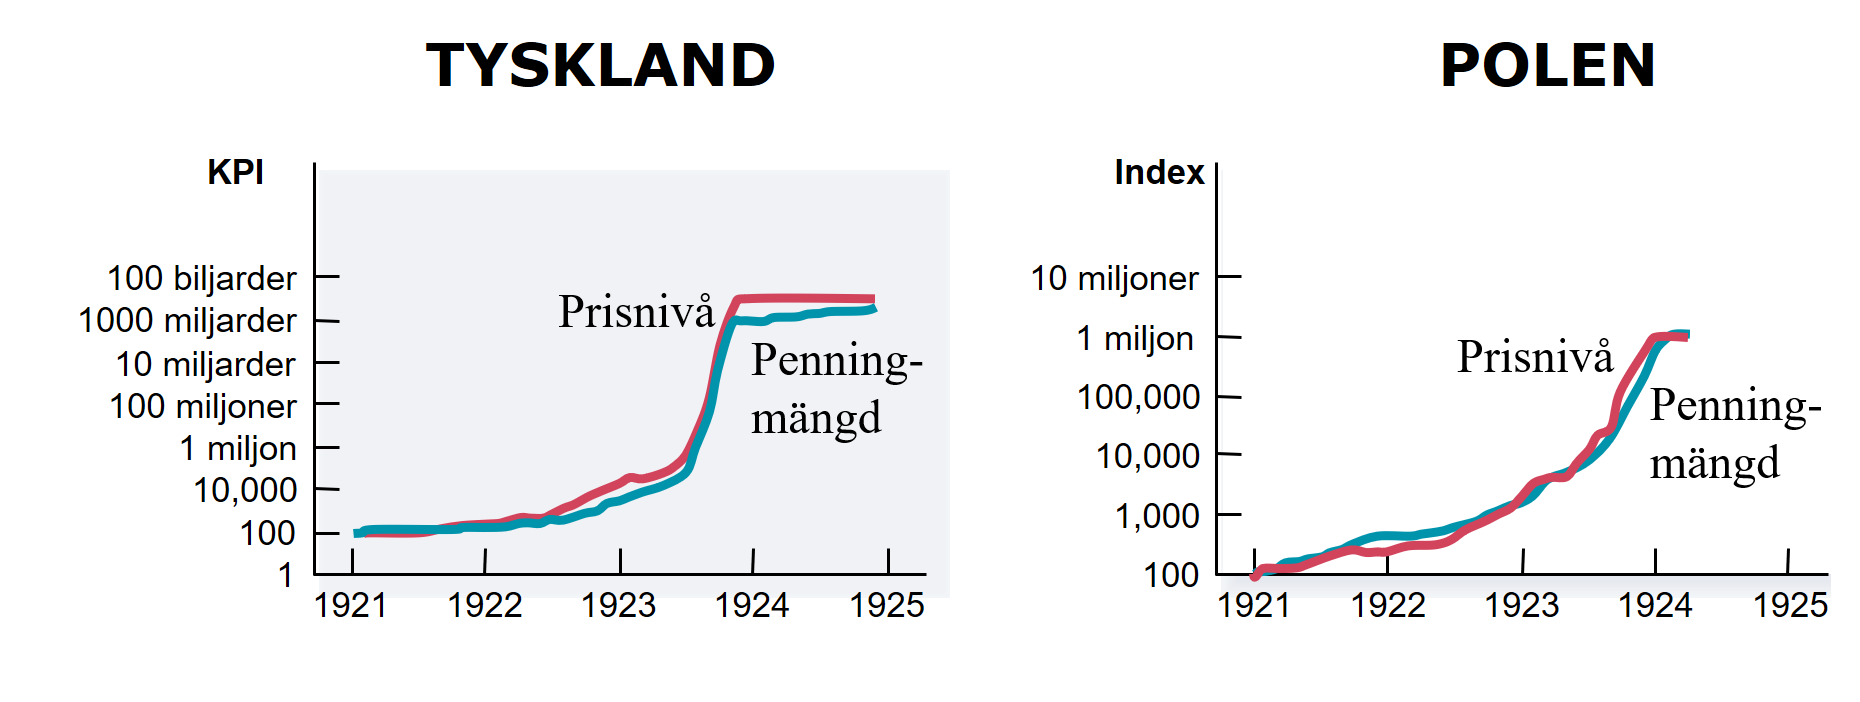
On the left of the chart you see the situation in Germany. In 1921 the CPI is 100. As the graph shows, the price level then soars over the following years; Germany was plunged into hyperinflation. Note how closely the price level tracks the money supply. You see the exact same pattern for neighbouring Poland. The evidence is strong: the hyperinflation of the 1920s appears to have been caused by authorities printing too much money.
But why on earth did Germany choose to print so much money? Imagine yourself as finance minister in Berlin in 1921. Germany has just lost the war and the country lies in ruins. Tax revenues are likely tiny because the economy is shattered. At the same time expenditures are enormous: besides a huge war reparations bill the country must be rebuilt and many people need transfers. Small revenues and large expenditures mean a budget deficit that must somehow be financed. But Germany’s reputation is in tatters; getting anyone to lend to Germany is virtually impossible. The sad truth is that there is practically only one way to finance the spending: print more money. That may rescue the country in the short run — but in the long run it will unquestionably lead to inflation.
The problem becomes even worse if people expect inflation. Imagine you work in a café in today’s Venezuela and are called in for wage negotiations. You’d probably think: “Inflation has been a million percent per year for the past decade. Prices will likely rise by a million percent next year as well. Staying on my current wage is not an option. I need a massive pay rise to offset prices becoming a million percent more expensive. My absolute minimum demand is therefore a one‑million‑percent wage increase.”
The lesson is this: if we expect inflation, inflation tends to occur. Your father asks for higher pay because he expects prices to rise. Fabbe raises his prices because he expects everyone else’s prices to rise. High inflation therefore tends to become self‑fulfilling. In the next chapter we will examine what a society can do to keep inflation at a reasonable level.
Exercises
In this chapter you have learned why the general price level sometimes rises or falls — and what effects this has on the economy. Below are some cases where you can apply your knowledge in practice. Press Show Answers when you want the computer to grade your responses. Good luck!
Inflation i Finland
The figure below shows inflation and unemployment in Finland for 1975–2025.
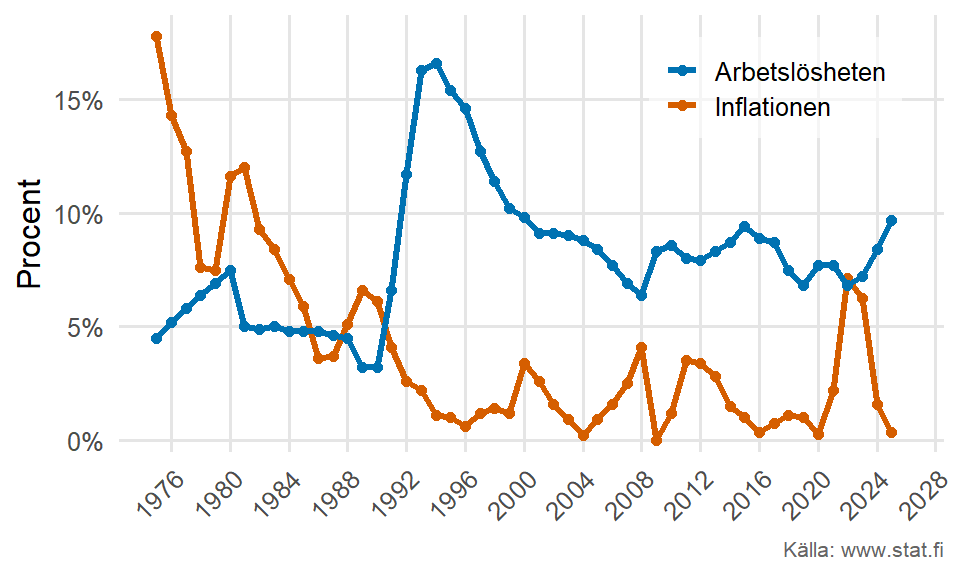
- Du kan se Finlands Konsumentprisindex (KPI) under åren 2010-2025 här. Från år 2024 till år 2025 rådde eftersom KPI steg med cirka och från 2014 till 2015 rådde eftersom den allmänna prisnivån sjönk med cirka .
- Det så kallade Eländighetsindexet (eng. Misery Index) är summan av inflation och arbetslöshet. Enligt figuren ovan var Eländighetsindexet i Finland år 2024 cirka .
- Under några enstaka månader under de senaste 50 åren har Finland upplevt deflation. Vad är den stora faran med deflation? Förklara med egna ord.
- Även Sverige plågades av hög inflation under 1970-talet. År 1979 fick min farmor efter ett hårt arbetsliv äntligen en rejäl löneförhöjning. Hennes lön höjdes från 8 000 kronor till 8 600 kronor. Samtidigt steg KPI i Sverige från 95,3 till 107,2. Vad hände med min farmors reala inkomst, det vill säga hur mycket varor och tjänster hon kunde köpa för sin inkomst?
- Klicka på länken och se vad som har hänt med KPI. Mellan 2024 och 2025 steg KPI från 133,08 till 133,54, vilket motsvarar en procentuell ökning på cirka 0,34 procent. Från 2014 till 2015 så sjönk KPI däremot från 109,01 till 108,78; deflationen var därför 0,2%.
- Inflationen under år 2024 var cirka 1,5 procent och arbetslösheten låg kring 8,5 procent. Eländighetsindexet var alltså cirka 10.
- Läs Section 17.6 och se till att du verkligen förstår idéerna! Klarar du av att sammanfatta det här på några meningar?
- Farmors nominella lön - alltså det som står på hennes arbetskontrakt - ökade från 8000 till 8600 kronor, vilket motsvarar en ökning på 7,5 procent. Men det här innebär inte nödvändigtvis att farmor kan handla 7,5 procent mer varor och tjänster. För att se vad som händer med farmors reala inkomst - vad hon kan köpa för dina pengar - måste vi också se vad hur prisnivån i landet har förändrats. KPI-siffrorna visar att priserna steg med nästan 12,5 procent. Hon fick alltså 7,5% högre lön, samtidigt som allt blev 12,5% dyrare. Detta innebär att hennes köpkraft föll med approximativt 5%.
Hyperinflationens orsaker och konsekvenser
Följande karta visar hur inflationen såg ut i världen år 1990. Som du ser plågades många länder i Sydamerika av extremt hög inflation.
- Varför uppstår hyperinflation?
- År 1990 var inflationen i Peru 7 500 procent. Här var menykostnader och shoe-leather costs troligen mycket höga. Vad innebär detta?
- Utöver menykostnader och shoe-leather costs skrev jag i kapitlet om ytterligare två svårigheter som uppstår när man lever i ett land med hög inflation. Vilka var dessa svårigheter? Förklara enkelt på begriplig svenska.
- Varför tror du att myndigheterna i dessa sydamerikanska länder ökade mängden pengar fastän det leder till hyperinflation?
- Läs Section 17.7. Att prisnivån i ett land stiger kan bero på många faktorer, men riktigt hög och ihållande inflation - tänk Ungern 1946 - beror på att mängden pengar i samhället har ökat.
- I avsnittet om inflationens skadeverkningar går jag igenom dessa saker tydligt. Kom ihåg att träna aktivt på att svara på frågan. Skriv alltså ner svaret på till exempel tre meningar. Läs meningarna högt. Kommer den som rättar din tentamen att förstå vad du menar eller uttrycker du dig luddigt?
- Se ovan.
- I kapitlet förklarar jag tydligt, så läs och skrev ner ett eget svar med egna enkla ord. Går det att förstå vad du menar? Om inte, försök att förbättra ditt svar!
- Mer om betygsinflationen i Sverige kan du läsa här
- Om livet i hyperinflationens Venezuela kan du se ett nyhetsinslag här: