13 Growth for pros
(where you learn modern growth theories and explore the consequences of growth)
In the previous chapter you learned the basics of economic growth. You learned, among other things, that resources and technology determine how fast an economy grows: we can become richer by putting more hands and more capital into production, but we can also raise output by using existing resources more cleverly. But how exactly do you “use existing resources more cleverly”? What makes some countries discover smarter ways of working while others tread water year after year? In this chapter we cover the endogenous growth theory and the institutional growth theory, two modern models that help explain income differences between countries. At the end of the chapter we will also examine how economic growth affects societal wellbeing and our environment.
13.1 Endogenous growth theory
With growth accounting we could split a country’s economic growth into three parts: how much is due to more labour, how much to more capital (machines, buildings, etc.) and how much to better technology. In Table 12.2 we saw, for example, that technological progress raced ahead in Japan between 1950 and 1973. That made the country rapidly one of the richest in the world.
But why did Japan’s technical know‑how increase so much, and why precisely during that period? Understanding what drives technological progress is especially important. The neoclassical growth model does allow income to rise by 1) people working more hours or 2) saving and investing a larger share of income in new capital — but a day still has only 24 hours and you cannot invest more than 100 per cent of your income. Thus there is a limit to how much growth you can get from more labour and more capital. Technology, by contrast, appears to have no obvious upper bound: humans constantly invent new ways to use resources more cleverly. In the long run it is therefore technological progress — learning to use resources better — that can sustain economic growth decade after decade.
Endogenous growth theory looks precisely at this question: why does country A manage to improve its technology while country B fails? Or in other words: what is required for an F1 tyre change to become faster and for cashiers to get more done at work? The main conclusion of the theory is that education drives technological improvements. A person who has studied is, according to the theory, simply more likely to figure out smarter ways of doing things.
Spending on education and research is therefore one of the keys to technological progress. Human capital is a catch‑all term for your education and skills. But how do you practically get more people to choose to study? Let us briefly create a simplified toy model of the decision to study or not. Very roughly speaking you have two paths through life. You can see them in the figure below:
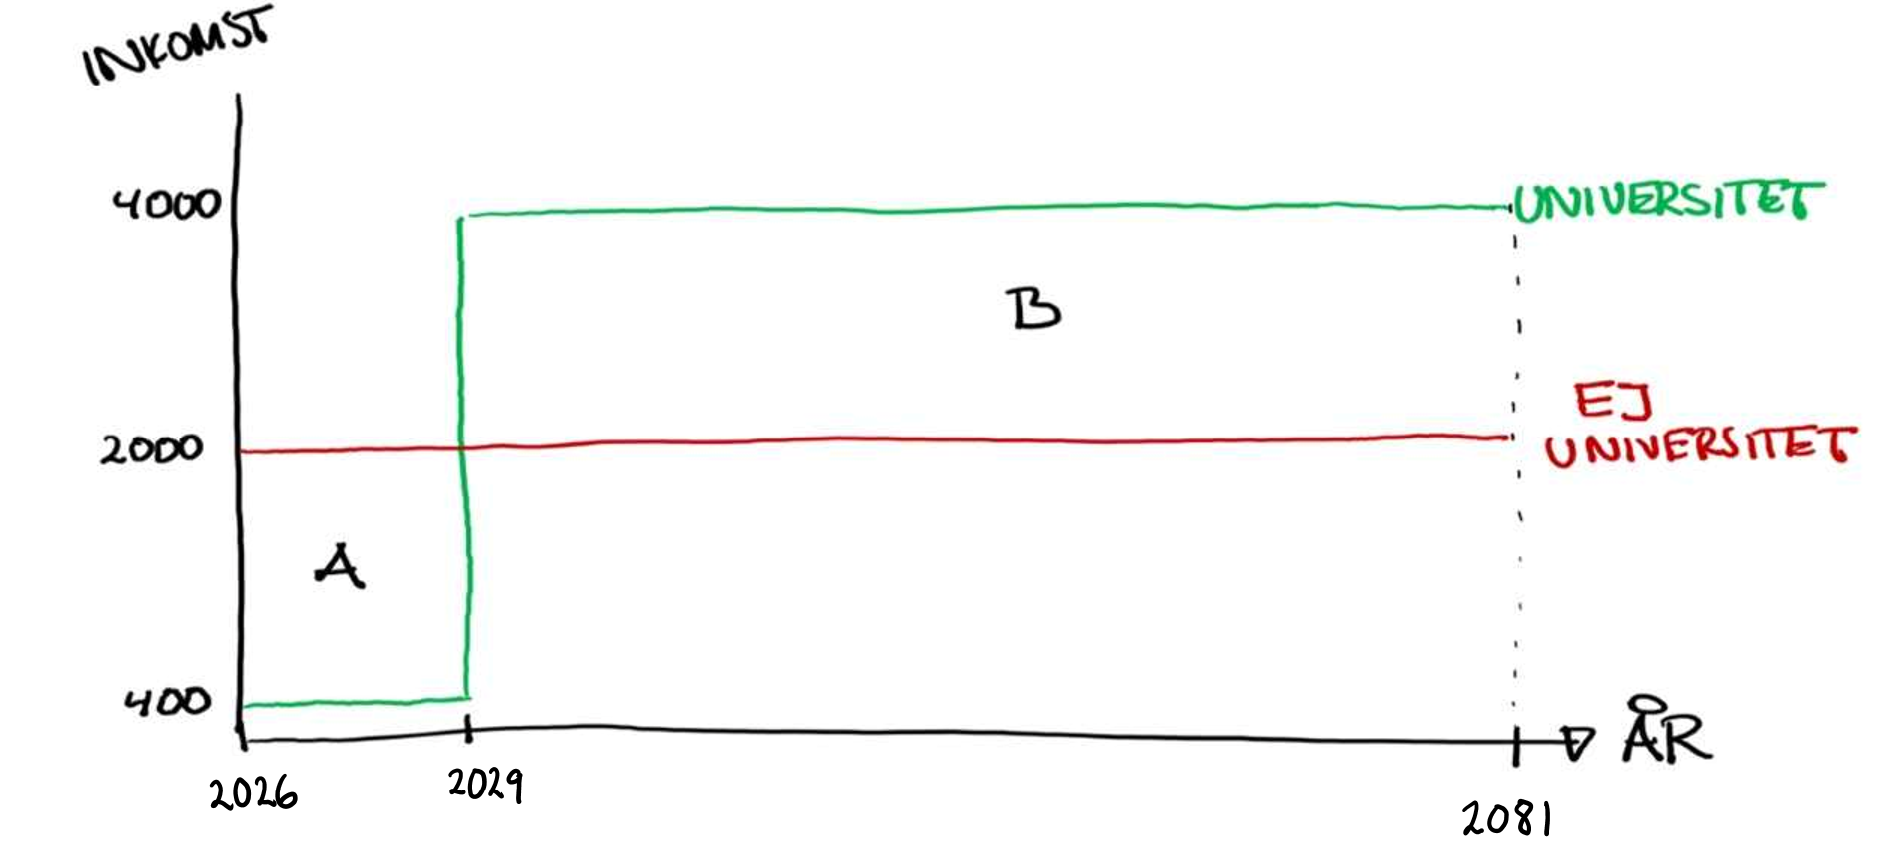
The red curve shows your lifetime earnings if you enter the labour market today. If instead you spend three years studying at Åbo Akademi (and manage to graduate), you can expect earnings along the green line. The downside of studying is that during your studies you forgo the income you would have earned had you not studied. But there is also an economic upside: from 2029 onwards your salary is much higher than it would have been if you had not studied.
So is it worth studying? In this model it depends on whether area B is larger than area A. A policymaker who wants more people to study can therefore (at least according to our theory) try to make area B as large as possible relative to area A. Can you think of measures that would achieve this? On the right you can see what the students answered last year.
How to get more people to continue studying? (according to last year’s students): “higher study grants”, “lower interest on student loans”, “faster degree completion”, “lower taxes on high incomes”, “higher retirement age”, “greater wage dispersion”, “cheaper student lunches”.
Is university study worth it?
In Figure 4.1 we saw that Finns with a university degree earn substantially more than those without. At first glance you might therefore think a degree is a jackpot that automatically leads to a high income — but do you see why that conclusion is probably not quite right?
Think again of the fork in the road in Figure 1.1. You chose the university path, while your friend chose the other. Was it really just luck that led you to take different routes through life? Maybe you had top grades at upper secondary school, while your friend barely passed. If you earn three times as much as your friend in 20 years, it does not necessarily follow that it’s your university degree that made the difference. It could just as well be that you were already different back in secondary school.
So how can we measure how a university degree actually affects our incomes? One method is matching analysis, which we used in the previous chapter.

The principle is as simple as it is brilliant: for every person with a university degree the computer finds a comparison person who does not have a degree but is otherwise as “identical” as possible. If you, for example, are a woman born in 2004 with a high‑school GPA of 8.1, raised in Helsinki and with less‑educated parents, the computer picks another woman of the same age from Helsinki who also had an 8.1 GPA and less‑educated parents — but who, unlike you, does not have a university degree. The income difference between the two is then our estimate of the degree’s causal effect on earnings. In a few seconds the computer performs this analysis for all people in Finland with a university degree. The table below shows the results for Finland in 2023:
| Variable matching | Difference in annual income (€) |
|---|---|
| No matching (raw difference) | +€18,743 |
| Match on age | +€17,858 |
| + Match on municipality | +€17,267 |
| + Match on gender and ethnicity | +€18,378 |
| + Match on family situation | +€17,482 |
To create the table above I extracted information on everyone living in Finland at the end of 2023. I then removed all individuals younger than 25 or older than 65. The result was a list of almost 3 million Finns of working age, of whom 41.8 per cent had some form of tertiary degree.
The row “No matching (raw difference)” shows that people with a tertiary degree earned on average EUR 18,743 more per year than those without one (€51,418 vs €32,675). On the next row I instead compared annual incomes between degree‑holders and non‑holders who were the same age. As you can see, this reduces the gap by almost €1,000. One interpretation is that degree‑holders tend to be older than those without degrees, and older people typically earn more for other reasons (for example because they usually have more labour market experience).
On each subsequent row I compare people who are increasingly similar, and on the final row I compare highly educated and less educated individuals who are the same age, live in the same municipality, have the same gender, ethnicity and mother tongue, the same family situation and the same number of children. Even here most of the annual income gap between the groups remains. That highly educated people earned so much more than less educated people in Finland in 2023 therefore does not seem to be due to their being older or living in high‑wage municipalities. It appears plausible that the degree itself contributes to substantially higher income.
An interesting question is why employers are willing to pay so much more to someone with a university degree. Many economists believe this is because education actually makes you more productive. According to human capital theory, you learn things during your three years of study that make you “better” — and firms are therefore willing to reward you with a fat salary. Several patterns make it reasonable to think education raises productivity. First, countries that have invested heavily in education also tend to have high technological development. Second, the so‑called Flynn effect shows that IQ test scores have risen over a long period and across large parts of the world. One possible explanation is that education has expanded during this period. Economists are therefore generally big fans of education. Gregory Mankiw has said that differences in education levels between countries can explain much of the variation in living standards across countries.
On the other hand, some economists argue that higher education does not necessarily make you smarter or more competent. According to signalling theory, which we discussed here, university may simply be a way for you to signal to employers that you have the qualities they value. It is then not the education itself that increases productivity, but the fact that you already possessed traits — ambition, ability and motivation — that employers value. University can thus be seen as a way of revealing those traits to employers rather than producing them.
13.2 Institutional growth theory
Economic growth over the past 200 years has fundamentally changed the world. South Koreans are on average 32 times richer than in 1950, Romanians 20 times richer, and Chinese 16 times richer. However, there are also countries that have stagnated or even become poorer. Figure 13.1 reveals an intriguing pattern. The horizontal axis shows GDP per capita in each country in 1950, while the vertical axis shows the corresponding figures today. Take Botswana, for example, which you can see near the top of the figure. The rise in prosperity there has been remarkable: from USD 1,300 in 1950 to USD 15,000 in 2016. Botswana’s extraordinary growth has likely transformed living conditions in ways that are almost hard to imagine.
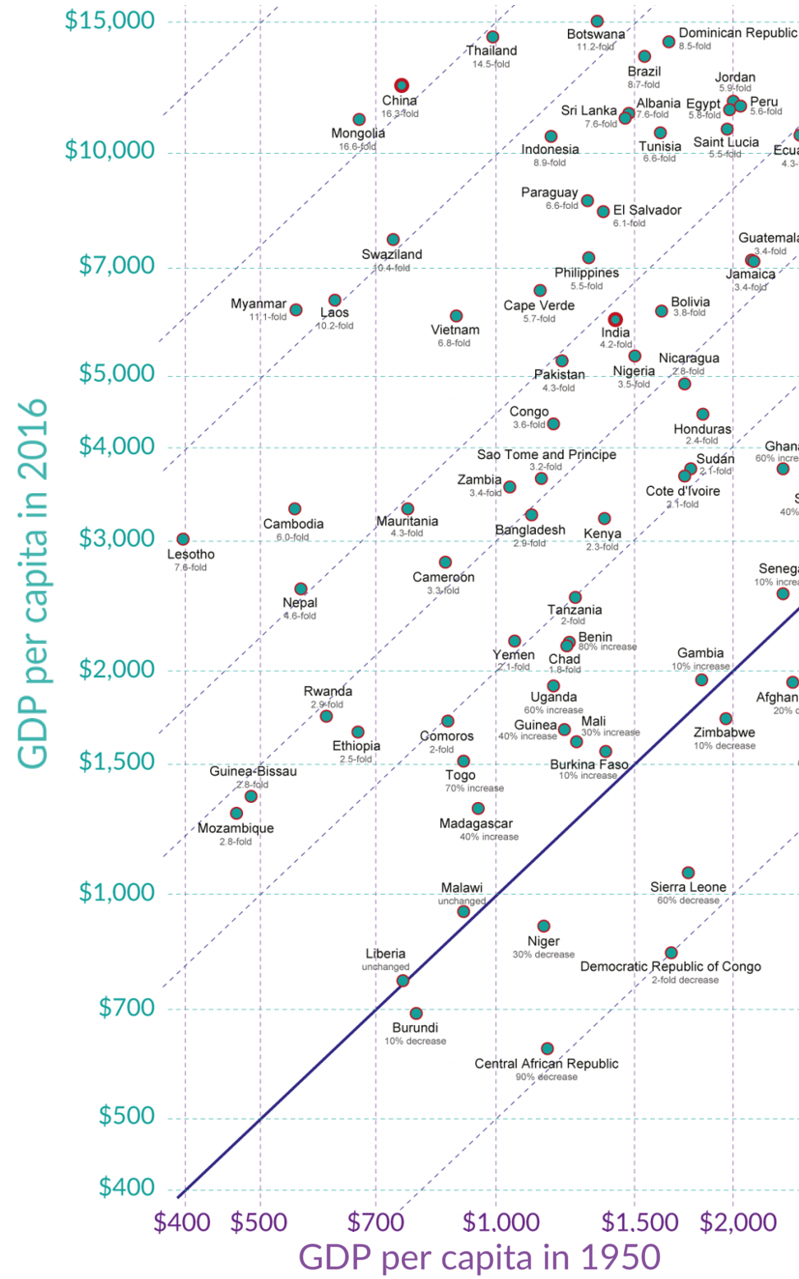
But now find the Democratic Republic of the Congo and the Central African Republic in the figure. You’ll find them almost at the bottom. These are neighbours of Botswana — and they were roughly as rich as Botswana in 1950. Note, however, that GDP per capita has fallen in these two countries since 1950. How is that possible?
It cannot be explained by convergence, because the three countries were similarly poor in 1950. Botswana has indeed invested more in education and devotes a larger share of its GDP to investment — but those differences are not nearly large enough to explain why people in Botswana are now 25 times richer than their neighbours.
So why are some countries still so poor — even though they have invested for the future (as the neoclassical theory prescribes) and expanded education (as endogenous growth theory prescribes)? The institutional theory emphasises that some fundamental conditions are absolutely necessary for the growth engine to start at all. Without these, the country will remain poor even if it follows the recipes of the other growth theories. Which conditions, then, must be in place according to institutional theory? Three factors seem to characterise almost all countries that have kick‑started growth: stability, functioning markets and equality before the law.
Stability is often a prerequisite for prosperity. Of course you are less inclined to back a clever business idea if the country is a lawless bandit state where everything can be taken from you. The institutions of the country matter: the judiciary, property rights, the state’s role and social norms are crucial. Take Argentina, for example, which was one of the world’s richest countries in the early 20th century. Since then it has fallen down the prosperity rankings. What went wrong in Argentina? One clue is the string of military coups it endured: 1930, 1943, 1955, 1962, 1966 and 1976. Who thinks that was favourable for Argentina’s economy?
Functioning markets are also important. Markets, despite their flaws, have proved a good way for countries to achieve wealth. Does policy make it profitable to create things? Does the state facilitate entrepreneurship? And do you think the 220 days you have to wait to start a business in Venezuela is good or bad for their economy? To understand why a country is poor or rich you must therefore understand how market mechanisms determine production and distribution. You learned all this in the first half of the book.
Equality before the law has likewise proven to be a prerequisite for economic prosperity. Before 1800 — and still in many countries — clear hierarchies prevailed: men over women, masters over servants, rich over poor, whites over blacks. You were stuck and never got a chance. For example, the guild system was abolished in Finland in 1809 and in Sweden in 1846. The guilds were a bureaucratic system that regulated who could work in which trades. They specified, for instance, how many sugar bakers could operate in a town and what kinds of buns a sugar baker could make. Privileges were hereditary; only when the old sugar baker died could a new one take over. Aspiring entrepreneurs thus faced a long and obstructed path.
According to institutional theory, our rise to wealth was therefore due to political and sociological change — we became equal before the law and to one another. Suddenly many more people had the chance to do things better. It often goes exceptionally well when very many people are given the opportunity to experiment — without being blocked by the police, the law or prejudice. Previously you were stopped — because you were a woman, poor, foreign or lacked a licence. Since the early 19th century more and more people around the world have been given a chance. The discovery that changed everything was that ordinary people are creative.
endogenous growth theory argues that education is the key to kick‑starting technological progress
institutional growth theory argues that certain basic institutions are essential for a society to function economically at all; crucial elements include functioning markets, clear property rights, stability and a willingness to be open and cooperate
Data: The importance of property rights for prosperity
Let us now examine how important property rights actually are for economic prosperity. But how can we do that? Finland ranks first in the world for protection of property rights. In no other country is your property better protected than in Finland. At the bottom of the list are Haiti and Congo. Here the risk that your property will be seized arbitrarily is greatest. But is it really Finland’s rock‑solid property rights that have made us so much richer than Haitians and Congolese? After all, there are hundreds of other differences between Finland and Haiti or Congo that might actually explain why we are rich and they are poor.
You can view the full property‑rights ranking here.
This is the same classic challenge faced in all research. We discussed the problem in Section 4.1 and showed how to get around it when you want to measure how your later‑life income depends on whether you fought in Vietnam, obtained a higher education, or had children. Exactly the same type of method can now be used to examine the importance of property rights for prosperity.
Acemoglu et al. (2001) found a brilliant way to measure the relationship. The idea was so good it helped earn Acemoglu the Nobel Prize in Economics in 2024. (If you wish, you can read more about his research in the For those who want to know more tab at the end of the chapter.) Acemoglu dug deep into history and discovered that today’s property‑rights outcomes in African countries partly reflect a random colonial‑era circumstance from centuries ago. The researchers found that Europeans did not bother to build functioning property‑rights institutions in areas where deadly diseases — principally malaria — were common. Why build institutions where few Europeans dared settle? In neighbouring regions with lower disease burdens more colonists moved in, so it was worth establishing institutions there. The historical prevalence of disease, which can be read from colonial‑era mortality statistics, turns out to be strongly linked to today’s economic prosperity. Where diseases were most dangerous for Europeans we still find dysfunctional economic systems and the poorest countries — places with the highest corruption and weakest rule of law.
The table below shows the results from Acemoglu et al. (2001):
| High 19th‑century mortality | Low 19th‑century mortality | Differences | Conclusion | |
|---|---|---|---|---|
| Log GDP per capita 1995 (dollars) | 6.5 | 8.5 | -2 | Weak property rights lead to lower GDP |
| Risk of property being expropriated in 1995 | 8 % | 4 % | +4 |
Table 13.2 shows that areas where European colonists faced high mortality risk from deadly diseases are poorer today, 200 years later, than areas where mortality was low. We also see that property rights are stronger in areas with lower historic mortality, likely because more Europeans settled there and established property‑rights institutions. Acemoglu et al. (2001) argues that this provides evidence that functioning property rights are an important explanation for economic prosperity.
13.3 Growth and happiness
One final caveat: is economic growth really something to strive for? We have seen that people in high‑GDP countries tend to live longer and enjoy more comfortable lives, but are they also happier than people in poor countries? In short: does money make you happy? In the clip below Noel Gallagher, singer of Oasis, muses about happiness and money.
But let’s instead look at the data. The following figure shows the relationship between GDP per capita and life satisfaction. What conclusions do you draw from the figure?
We will look at an interesting paradox. Some studies point to 1) rich people being, on average, happier than poor people right now (just like in the figure above), but also 2) your grandmother when young being about as happy as you are today. How can this be? The first point suggests that money makes you happy — so how could your grandmother have been just as happy when she was much poorer? This is called the happiness paradox. Another way to think about the paradox is to compare a photograph with a film. If we freeze time — like in a photograph — the rich are on average happier than the poor. But if we look over time — like in a film — it’s as if money no longer affects how happy we become.
Why does the happiness paradox arise? Imagine you can choose between two careers. If you take the red pill you get a job paying EUR 4,000 while everyone else earns EUR 4,500. If you take the blue pill you get EUR 3,900 while others earn EUR 3,600. Which pill would you choose? Surprisingly many prefer the latter. What matters to us is therefore not only how we fare ourselves, but also how much we have relative to others. If your grandmother belonged to the poorest in Finland when she was young and you also belong to the poorest now, it matters little that you objectively have far more money than your grandmother. It may be your rank that determines happiness, not money per se.

So how does the world work? Do we become happier with more money? In an exercise at the end of the chapter you will examine the relationship between money and happiness yourself.
13.4 Growth and the environment
Another objection to economic growth is that it leads to a worse environment. The following figure summarises what researchers think about the relationship between GDP and various types of emissions.
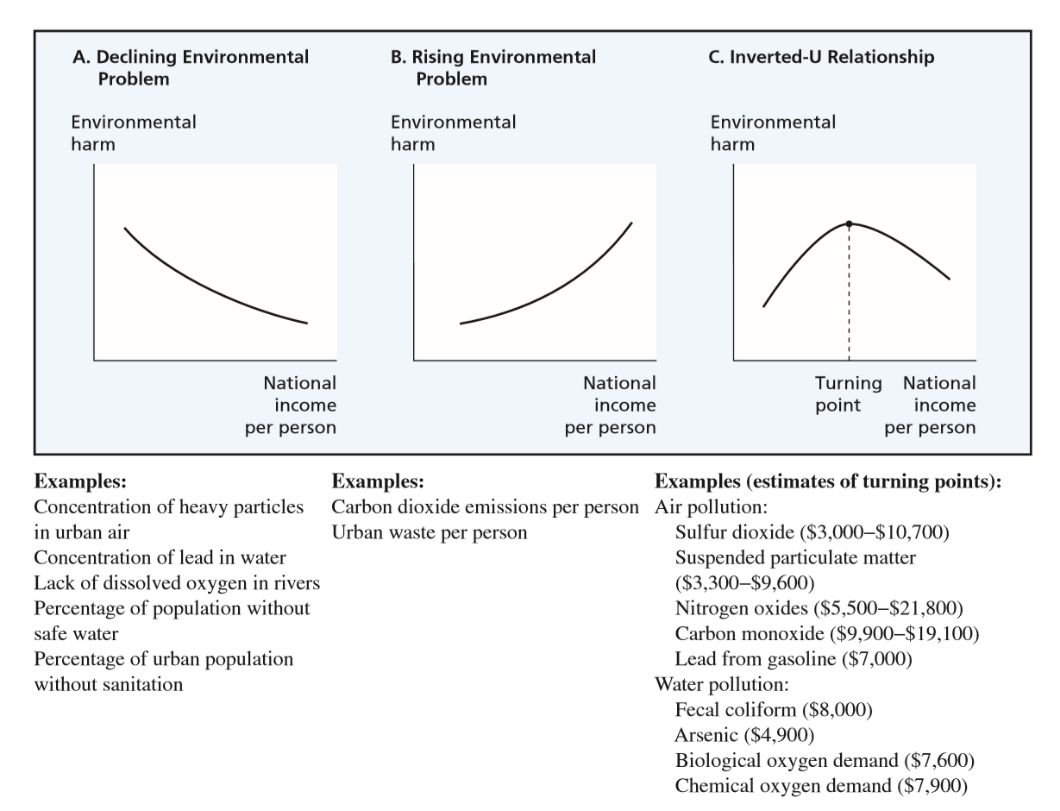
The left‑hand panel in Figure 13.2 shows that many types of pollution fall as a country gets richer — for example, lead in lakes. Think of “clean environment” as a good: as you get richer you can afford a cleaner environment just as you can afford better food. The middle panel shows a huge challenge for the future: the richer a country becomes, the more CO2 it tends to emit — and CO2 drives global warming.
Many pollutants, however, follow the pattern in the right‑hand panel. Emissions first rise as a country gets richer, but after a certain income level they turn down and the environment improves as income increases further.
Measuring the relationship between GDP and emissions is therefore crucial. Does economic growth reduce emissions, as in the left panel, or increase them, as in the middle panel? Or is the relationship more complicated, as in the right panel? At what income level, if any, do emissions start to fall? If Finland lies to the left of the turning point, further growth will worsen emissions; if it lies to the right, growth will reduce emissions.
In an exercise at the end of the chapter you will investigate the relationship between economic growth and CO2 emissions yourself.
the neoclassical growth theory states that a country can temporarily become richer by investing more in new capital, but that sustained growth can only occur through technological progress — that is, by producing more with given resources
endogenous growth theory argues that education is the key to kick‑starting technological progress
institutional growth theory argues that certain basic institutions are essential for a society to function economically at all; crucial elements include functioning markets, clear property rights, stability and a willingness to be open and cooperate
Exercises
In this chapter you have learned why some countries become rich while others remain poor. You have also examined the relationship between growth, happiness and the environment. Below are some cases where you can apply your knowledge in practice. Press Show Answers when you want the computer to grade your responses. Good luck!
Growth and happiness
Is it true that economic growth does not lead to increased happiness in the world? You will now analyse the question. The following map shows the relationship between GDP per capita and life satisfaction.
- Click Table. In 2024 the world’s happiest country was , while the country with the most unhappy population was .
- The happiness paradox says that .
- Explain in your own words what might explain the happiness paradox.
- Now test whether the rich are indeed happier than the poor. Click Chart. The chart shows that in 2024 the population of rich countries was on average satisfied with life than the population of poor countries.
- Next investigate whether economic growth makes us happier. Click Settings and tick Display average annual change. Choose a start year and an end year using the time axis. The chart will now show how a country’s “happiness” changed depending on how much richer the country became during the period. In the top‑right quadrant are countries that became both richer and happier; in the bottom‑right quadrant are countries that became richer but less happy. Does the happiness paradox hold according to your study?
- Why do you think Finland tops the happiness list despite currently having, among other things, the highest unemployment in Europe and the same GDP per capita as in 2007?
- In the field of happiness economics researchers study what drives wellbeing. Micael Dahlen is a professor at the Stockholm School of Economics’ Center for Wellbeing, Welfare and Happiness, which studies society, the future, consumer behaviour and people’s pursuit of happiness. Here is a short clip (1 minute) where Micael explains a bit more:
- Note that “paradox” means “something contradictory”. In this question you should therefore explain the strange phenomenon that a) rich countries on average are happier than poor countries and b) when a country becomes richer its people apparently do not become happier. How can a and b coexist?
- Here there appears to be a clear positive relationship: happiness is generally higher in rich countries than in poor ones.
- Here the relationship is less clear. There are indeed many countries where happiness rose as the country got richer — but there are almost as many countries where happiness fell as the country grew richer. My conclusion is therefore that the happiness paradox does seem to have held during 2011–2024.
Growth and CO2 emissions
In this exercise you will investigate the relationship between GDP and carbon dioxide emissions yourself. The map below shows the relationship between GDP per capita and CO2 emissions for the period 1750–2022.
- Click Table. The country whose residents currently emit the most CO2 per capita is , while the country with the lowest CO2 emissions per capita is .
- Click Chart. Countries with high GDP per capita emit on average CO2 per person than countries with low GDP per capita.
- Now investigate whether economic growth leads to higher CO2 emissions. Click Settings and tick Display average annual change. Select start year 1990 and end year 2022 on the timeline. The chart will now show how CO2 emissions in each country changed depending on how much richer the country became over the period. The top‑right quadrant therefore contains countries that became both richer and emitted more CO2, while the bottom‑right quadrant contains countries that became richer but reduced their CO2 emissions. What conclusions do you draw about the relationship between economic growth and CO2 emissions?
- Some theories (see Figure 13.2) suggest the relationship between GDP per capita and environmental emissions is an inverted U: emissions rise as a poor country becomes richer, but emissions fall once a country is rich. Hover over the different regions in the figure [Africa, Asia, Europe etc.]. Does the relationship between economic growth and CO2 emissions appear different in poorer and richer parts of the world?
- Pugel (2016) argues that the global warming problem can be solved at a cost of roughly 2 per cent of GDP per year, but so far it has been politically impossible to implement the necessary economic interventions (for example a CO2 tax). Why do you think it is so difficult to introduce a tax on CO2 emissions?
1-5. How economic growth affects emissions is obviously a hot research area. At the start of year 2 you can take the course Environmental Economics if you want to learn more about these issues and much else.
- The last two years’ Nobel Prizes in Economics went to growth researchers. For popular‑science summaries see: for studies of how institutions are formed and affect prosperity, 2024 and for having explained innovation-driven economic growth, 2025.
- Book tip 1: Why Isn’t the Whole World Rich? On Power, Progress and Technology — by Nobel laureates Acemoglu, Robinson and Johnson. Available in ÅA’s library (e‑book here).
- Book tip 2: What Makes a Terrorist: Economics and the Roots of Terrorism by Krueger (2008) — e‑book available here.
- I wrote an op‑ed on entrepreneurship here.
- Matt Ridley provides an excellent account of how cooperation has lifted the world out of poverty:
- Economic growth will eventually alter the balance of power between the world’s countries. All the curves point to China dominating the global economy for the rest of your lifetime. Seven minutes on China with Sweden’s former finance minister Anders Borg here: